How Big Oil Is Heavily Damaging America.
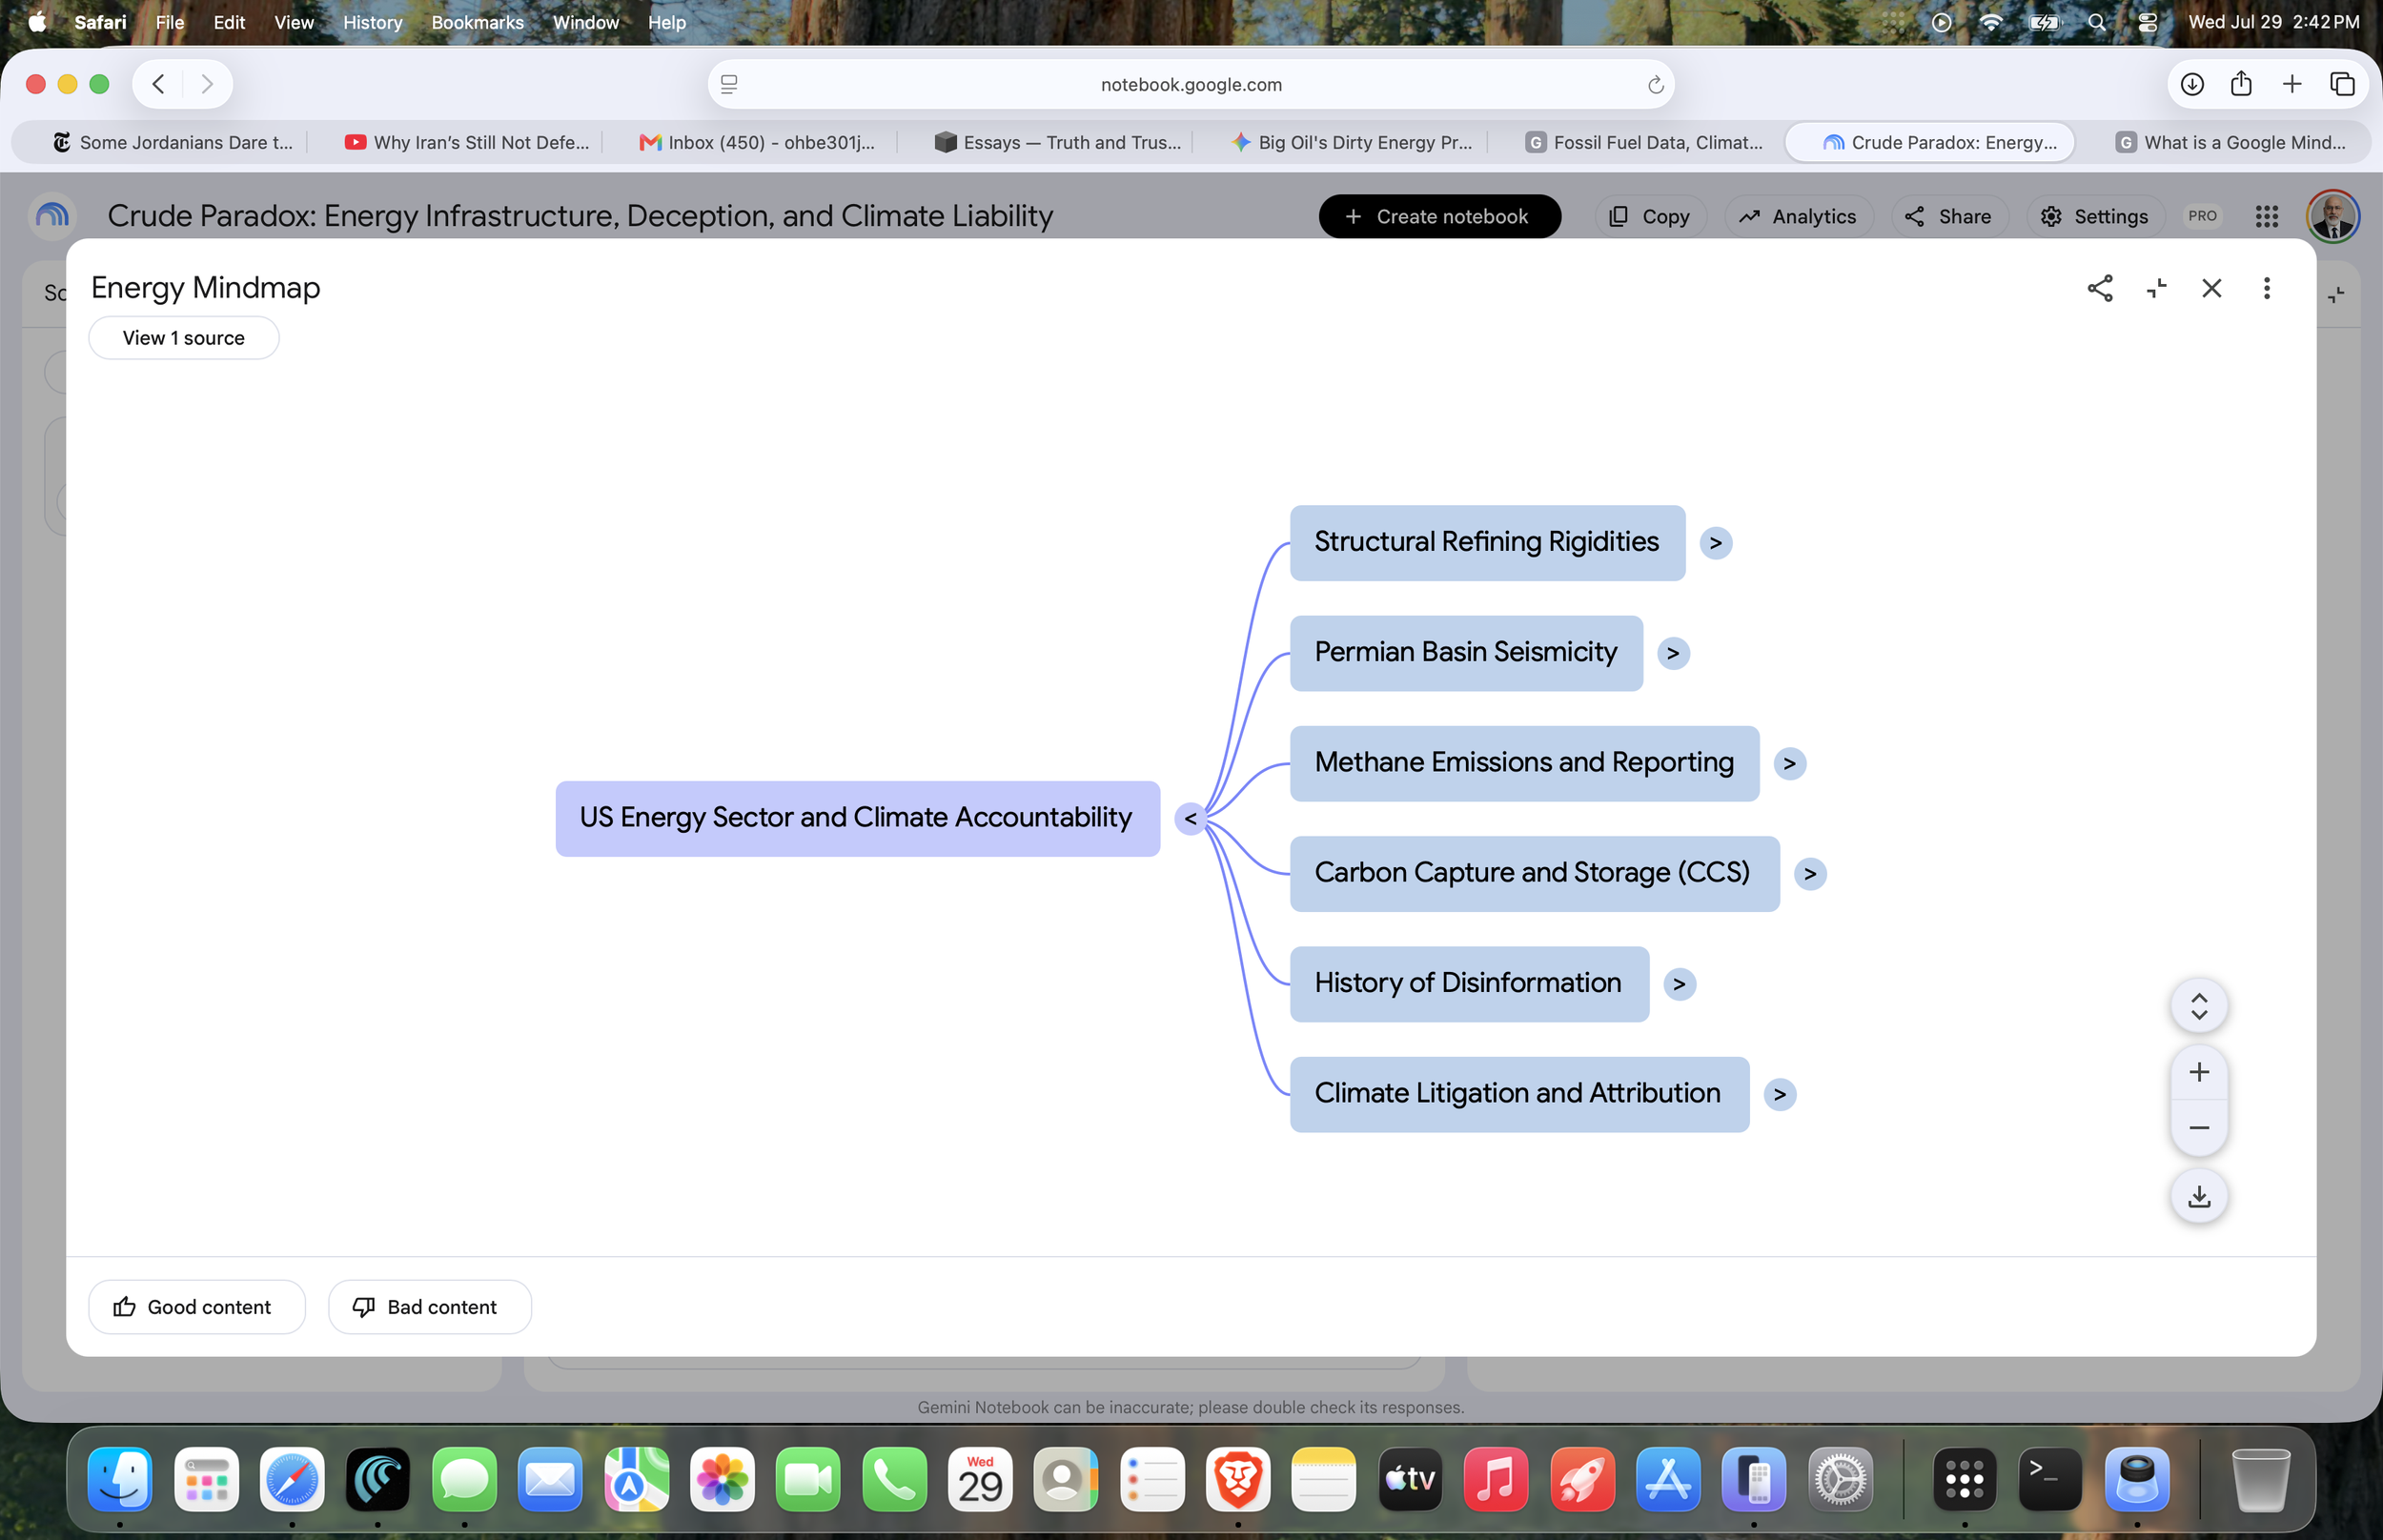
The video below does NOT fully explain the damage. There is an audio podcast at the bottom and after you’ve read the essay, seen the video and heard the podcast you’ll get a better idea of the secrets of the oil industry and how it is heavily damaging America not simply the environment.
Synthesizing the US Energy Landscape: Structural Rigidities, Climate Externalities, and the Legacy of Industry Disinformation
Structural Refining Rigidities and the API Gravity Mismatch Cement the US as a Perpetual Heavy Crude Importer Despite the Domestic Shale Boom
The United States energy sector is currently defined by a profound paradox: despite the “shale revolution” catapulting the nation to the status of a global hydrocarbon production powerhouse, the country remains structurally bound to importing millions of barrels of foreign crude oil daily. In 2021, the United States produced approximately 18.77 million barrels per day (b/d) of petroleum and consumed roughly 19.89 million b/d1. While the aggregation of raw crude and refined petroleum products allowed the US to claim the title of a net total petroleum exporter, an isolation of the raw crude oil data reveals a persistent deficit. Specifically, the US imported over 6.11 million b/d of crude oil while exporting 2.96 million b/d in 20211. This dynamic is largely driven by a chemical and infrastructural misalignment between the physical properties of domestically extracted shale oil and the highly specialized thermodynamic configurations of the domestic refining fleet.
The physical characteristics of crude oil dictate the required refining processes, with density—measured as API gravity—and sulfur content serving as the primary classification metrics. Light, sweet crude oils possess a high API gravity (generally greater than 30 to 45 degrees) and low sulfur content, allowing them to flow easily at ambient temperatures and yield high-value products like gasoline and light naphtha through relatively simple distillation1. Heavy, sour crudes, conversely, feature an API gravity below 22 degrees (with extra-heavy oils and bitumen falling below 10 degrees) and high sulfur concentrations1. These highly viscous raw inputs require complex, expensive secondary and tertiary processing to be economically viable1. The vast majority of the shale formations propelling the US production boom since 2010—including the Permian, Bakken, and Eagle Ford basins—yield extraordinarily light, sweet crude. For instance, in 2018, 56% of all crude oil produced in Texas featured an API gravity between 40 and 50 degrees, a category that has seen explosive growth4. Production of the lightest category of crude (API > 45.1 degrees) grew substantially, accounting for 28% of lower 48 state production by the first half of 20222.
However, the United States refining complex, highly concentrated along the Gulf Coast in Petroleum Administration for Defense District (PADD) 3, was engineered in the decades preceding the shale revolution. Anticipating a future defined by the depletion of domestic light oil and an increasing reliance on heavy, sour imports from Venezuela, Mexico, and the Canadian oil sands, petroleum corporations invested billions in deep-conversion infrastructure1. The most critical of these investments were coking units, which utilize extreme heat and pressure to “crack” heavy, low-value intermediate hydrocarbons into high-value middle distillates like diesel, jet fuel, and heating oil1. The commitment to this heavy crude diet is evidenced by the continuous historical expansion of PADD 3 coking capacity, which grew aggressively despite the onset of the shale boom.
| Decade | US PADD 3 (Gulf Coast) Coking Capacity Range (Barrels/Day) | Strategic Refining Implication |
|---|---|---|
| 1990s | 615,000 – 664,800 | Initial expansion anticipating domestic light crude depletion. |
| 2000s | 997,996 – 1,107,196 | Massive capital deployment to process incoming heavy sour crudes. |
| 2010s | 1,453,600 – 1,456,800 | Sustained heavy processing capability despite the onset of the shale boom. |
| 2020s | 1,669,407 – 1,681,907 | Locked-in infrastructural reliance on discounted heavy crude imports. |
Data reflecting the expansion of Gulf Coast coking capacity. Source: 7
If these sophisticated refineries were to abandon heavy imports and exclusively process domestic light sweet crude, their multi-billion-dollar coking units would sit idle, causing severe operational bottlenecks, unstable distillation curves, and diminished profit margins5. The economic incentive for refiners is dictated by the “crack spread”—the differential between the refiner acquisition cost of the raw crude (including freight) and the wholesale price of the refined outputs5. Because heavy crude typically trades at a steep discount to light benchmarks like West Texas Intermediate (WTI), Gulf Coast refiners maximize their crack spread by purchasing cheap, heavy crude and utilizing their coking units to produce high-value diesel5. For example, refiners capable of processing Western Canadian Select (WCS)—priced at a substantial discount compared to Gulf Coast Light—extract vastly superior margins by yielding high volumes of diesel and kerosene fractions6. In 2021, the US imported over 1.36 billion barrels of heavy oil, with Canada providing 75.1% of these imports, followed by Mexico (11.6%), Colombia (4.6%), and Ecuador (3.8%)1.
Consequently, the global arbitrage of crude oil dictates that the US exports its premium, expensive light sweet crude to simpler refineries in Europe, Latin America, and Asia, while replacing those volumes with discounted heavy sour imports5. The cost of global maritime transportation has fallen so low that it is economically superior for corporations to ship crude across the globe rather than retool a multi-billion-dollar refinery for a different crude diet6. Ultimately, because global demand growth is currently dominated by middle distillates (diesel and jet fuel)—for which light shale oil is suboptimal—the United States relies on heavy crude imports as a feedstock to optimize production, maximize corporate profits, and significantly augment its ability to act as a net exporter of refined petroleum products1.
Deep Wastewater Injection from Shale Extraction Triggers Unprecedented Seismicity, Forcing Drastic Regulatory Volume Curtailments in the Permian Basin
While the economic arbitrage of light and heavy crude drives the macroeconomic reality of the US energy sector, the physical extraction of shale oil has precipitated severe, localized environmental crises. The most acute operational externality currently threatening the Permian Basin—spanning West Texas and southeastern New Mexico—is a dramatic escalation in induced seismicity directly linked to the disposal of industrial wastewater.
Hydraulic fracturing and horizontal drilling are highly water-intensive processes. Furthermore, shale formations yield massive volumes of ancient, highly saline “produced water” that returns to the surface alongside the targeted hydrocarbons. Because this fluid is laden with heavy metals, chemical additives, and naturally occurring radioactive materials, the primary method of disposal is subterranean injection via Class II disposal wells9. While the US Geological Survey estimates that only a small fraction of the roughly 40,000 waste fluid disposal wells nationwide induce earthquakes large enough to pose public concern, the sheer magnitude and concentration of wastewater injected into the Permian Basin has fundamentally altered subsurface geomechanics9.
Earthquakes are induced when enormous volumes of fluid are pumped into deep geological formations, particularly those in close proximity to the crystalline basement rock underlying the sedimentary layers. This fluid injection artificially elevates pore pressure within preexisting, critically stressed fault zones10. As pore pressure rises, the frictional forces clamping the fault shut are overcome, precipitating slip and seismic activity10. The Permian Basin geology is highly susceptible to this phenomenon, as many large earthquake sequences align along a basement suture zone—an area of ancient crustal weakness10. Consequently, the region has experienced an unprecedented surge in both the frequency and intensity of tremors, capped by a magnitude 5.4 earthquake in the Gardendale area in December 2022, alongside dozens of quakes exceeding magnitude 3.510.
Recognizing the escalating threat to infrastructure and public safety, the Texas Railroad Commission (RRC)—the state’s primary oil and gas regulator—initiated aggressive interventions that signal a paradigm shift in how the basin operates. The RRC designated specific, highly active regions as Seismic Response Areas (SRAs), notably the Gardendale, Northern Culberson-Reeves, and Stanton SRAs10. Within these zones, the RRC implemented Operator-Led Response Plans (OLRPs) aimed at eliminating earthquakes of magnitude 3.5 or greater12.
The regulatory framework heavily targets deep disposal wells (typically injecting between 11,000 and 16,000 feet, below the Wolfcamp Shale formation), which present the highest risk of communicating fluid pressure to seismogenic basement faults12. In the Northern Culberson-Reeves SRA, the RRC mandated a 50% reduction in deep injection volumes across multiple wells and indefinitely suspended deep disposal entirely within the Gardendale SRA12. Shallow disposal wells (above the Wolfcamp in the Delaware Basin, or above the Strawn formation in the Midland Basin) are also subject to severe curtailments based on their proximity to seismic epicenters13. For example, shallow wells located within 2.8 miles (4.5 kilometers) of a magnitude 3.5+ earthquake were restricted to 10,000 barrels per day, with an allowance to increase to 15,000 barrels only if the operator financed and installed a seismic monitoring station integrated with the University of Texas at Austin’s TexNet system12.
Looking toward the mid-2020s, the RRC is instituting a sweeping overhaul of saltwater disposal (SWD) permitting guidelines that will reshape the basin’s operational economics. By 2025, the Area of Review (AOR) for new or amended SWD permits will expand from a 0.25-mile radius to a dual-buffer system extending up to 2.0 miles to account for broader pressure diffusion15. Operators will face a stringent Maximum Surface Injection Pressure (MSIP) penalty; if any improperly cemented or orphaned well is discovered within the 2.0-mile subject area, the MSIP is automatically reduced by 0.05 psi/ft to mitigate fluid migration risks15. Furthermore, applicants must provide exhaustive geological proof of fracture containment to ensure injection pressures do not breach confining rock strata15. As disposal options contract and compliance costs soar, operators are increasingly forced to recycle produced water for subsequent fracturing operations—a practice Chevron utilized for 60% of its Permian water in 202210. However, the mounting geotechnical constraints on wastewater disposal present a formidable long-term bottleneck to the boundless expansion of water-intensive shale extraction12.
Satellite Surveillance Exposes Massive Methane Under-Reporting, Threatening the Viability of Natural Gas as a Climate-Mitigating Bridge Fuel
The defining environmental argument advanced by the fossil fuel industry to justify the continued expansion of hydraulic fracturing is that natural gas serves as an essential “bridge fuel” in the transition toward a decarbonized economy. The foundation of this narrative rests on the combustion chemistry of methane; when burned for electricity generation, a natural gas combined-cycle (NGCC) power plant emits approximately 50% to 60% less carbon dioxide than a pulverized coal unit, alongside a 99% reduction in sulfur dioxide and mercury16.
However, natural gas is primarily composed of methane (CH4), an extraordinarily potent greenhouse gas that possesses over 80 times the global warming potential (GWP) of CO2 over a 20-year timeframe, and roughly 30 times the warming potential over a 100-year scale18. Consequently, the climate benefit of transitioning from coal to natural gas is entirely dependent on preventing fugitive methane emissions across the upstream production, midstream gathering, and downstream distribution supply chains19. Comprehensive life-cycle climate modeling has established a critical “break-even” threshold: if the methane leakage rate across the supply chain exceeds approximately 2.7% to 3.2% (depending on the specific GWP metrics and power plant efficiency assumptions used), the near-term climate impact of natural gas becomes worse than that of coal17.
Historically, federal regulators, including the Environmental Protection Agency (EPA), have relied on “bottom-up” greenhouse gas inventories. These methodologies multiply estimated activity data (e.g., the number of pneumatic valves, storage tanks, and compressors) by standardized emission factors. However, an extensive body of peer-reviewed research has proven that these bottom-up approaches drastically underestimate actual atmospheric emissions23. In a seminal 2018 study published in Science, Alvarez et al. synthesized extensive field measurements and concluded that the average methane leakage rate for the US oil and gas supply chain was 2.3%—approximately 60% higher than the EPA’s concurrent estimates19. The discrepancy arises largely because theoretical emission factors fail to capture abnormal operating conditions, stochastic equipment malfunctions, and unpredictable “super-emitter” events27. Empirical site surveys have demonstrated that a disproportionate share of emissions originates from specific equipment; one study of 15 production sites found that pneumatic devices and storage tanks accounted for 61% and 25% of total mass emissions, respectively28.
The advent of highly advanced, space-based remote sensing has provided undeniable, macro-level confirmation of systemic under-reporting. The MethaneSAT project, launched in 2024 by the Environmental Defense Fund (EDF) in partnership with Harvard University, deployed orbital sensing technology to provide high-precision, wide-swath quantification of area emissions across global oil and gas basins18. The resulting data, gathered before the satellite lost communications in June 2025, dismantled industry self-reporting narratives. Across the Permian Basin, MethaneSAT recorded staggering emissions of approximately 410 metric tons of methane per hour31. In stark contrast, the EPA’s Greenhouse Gas Inventory had estimated the region’s emissions at a mere 104 metric tons per hour31.
| Methane Assessment Methodology | Estimated Permian Basin Emissions | Variance from EPA Baseline |
|---|---|---|
| EPA Bottom-Up Inventory | 104 metric tons / hour | Baseline |
| MethaneSAT (Top-Down Satellite) | 410 metric tons / hour | ~ 400% higher than EPA estimates |
| Alvarez et al. 2018 (Supply Chain) | 2.3% total leakage rate | ~ 60% higher than EPA estimates |
Comparison of empirical measurement data against federal inventory estimates. Sources: 19, 23, 31
Crucially, satellite data allows for granular, basin-level comparisons that illuminate the direct impact of public policy on corporate behavior. Within the highly active Delaware sub-basin of the Permian, MethaneSAT exposed a sharp divergence across state lines. Oil and gas operators on the New Mexico side of the border exhibited a methane intensity (emissions relative to marketed gas production) of approximately 1.2%31. Conversely, operators on the Texas side operated with a methane intensity of 3.1%31. Because both regions share nearly identical geological characteristics, extraction technologies, and operator demographics (with a young well population driving over 70% of production), researchers attribute the severe discrepancy strictly to regulatory environments32. In 2021, New Mexico enacted stringent regulations outlawing routine flaring and mandating rigorous leak detection and repair (LDAR) regimes, whereas Texas maintained lax standards31.
This data carries profound economic and existential implications for the industry. The 3.1% leakage rate observed in the Texas Permian brushes directly against the 2.7%–3.2% break-even threshold, indicating that natural gas extracted from this massive region likely provides zero near-term climate benefit over coal17. The global picture is equally grim; MethaneSAT data revealed that across the world’s basins, mean methane intensity averaged 2.9% of marketed gas, roughly ten times higher than the 0.2% target pledged by 56 fossil fuel companies under the Oil and Gas Decarbonization Charter (OGDC)27. The sheer volume of wasted gas prompted the US Senate to launch a formal investigation in 2026, spearheaded by Senator Sheldon Whitehouse, citing the billions of dollars in lost commodity value and demanding measurement methodologies from supermajors like ExxonMobil and Chevron18. As industries utilizing natural gas as a feedstock (such as ammonia production) increasingly seek certified, low-methane gas to reduce their Scope 3 emissions, the failure to contain upstream leakage threatens the core marketability of shale gas in a decarbonizing world20.
Carbon Capture and Storage (CCS) Projects Exhibit Systemic Failure Rates and Function Primarily to Subsidize Enhanced Oil Recovery Rather Than Mitigate Emissions
Faced with the existential threat of escalating greenhouse gas concentrations and tightening international climate mandates, the fossil fuel industry has aggressively promoted Carbon Capture, Utilization, and Storage (CCUS) as a technological panacea. The premise is to capture CO2 at the point of combustion or industrial processing, compress it into a supercritical fluid, and inject it into deep geological formations. However, rigorous financial and technical audits of global CCUS infrastructure reveal a history of profound technological underperformance, paired with an economic model that fundamentally exacerbates, rather than mitigates, the climate crisis.
A landmark 2022 review conducted by the Institute for Energy Economics and Financial Analysis (IEEFA) assessed the performance of 13 flagship, large-scale CCS projects that collectively represent approximately 55% of the world’s current operational capacity35. The findings are devastating to the narrative of CCS as a reliable climate solution: seven of the projects severely underperformed, two failed entirely, and one was mothballed35.
In the power generation sector, the application of CCS has been a near-total failure. Globally, almost 90% of proposed CCS capacity in the power sector failed during the implementation stage or was suspended early35. The Kemper coal gasification plant in the US collapsed under massive cost overruns in 201737. The Petra Nova project in Texas, heavily touted as a successful coal retrofit, operated unreliably for just four years before being mothballed in 2020 due to mechanical failures and unfavorable economics triggered by low oil prices35. The only remaining operational power plant with CCS is the Boundary Dam facility in Canada, which has chronically missed its capture targets by approximately 50%35.
In the gas processing sector, which strips CO2 from raw natural gas to render it saleable, performance remains abysmal. The multi-billion-dollar Gorgon project off the coast of Western Australia—a joint venture by Chevron, Exxon, and Shell—underperformed its capture targets by roughly 50% over its first five years35. The project was plagued by severe engineering oversights, including leaking valves and water ingress into the CO2 pipeline; when supercritical CO2 mixes with water, it forms highly corrosive carbonic acid that can dissolve injection well equipment41. The Shute Creek facility in Wyoming similarly underperformed its lifetime capture capacity by roughly 36%35. While the industry frequently boasts a theoretical design capability of capturing 90% to 95% of facility emissions, historical data demonstrates this rate is virtually never sustained in practice, with no existing project consistently capturing more than 80%37. The only two projects deemed somewhat successful—Sleipner and Snøhvit in Norway—operate in a highly specific regulatory environment driven by punitive national carbon taxes that aggressively penalize venting35.
Beyond technological failure, the fundamental economic driver of CCUS undermines its stated environmental purpose. Globally, approximately 70% to 90% of all captured carbon is not permanently sequestered for climate benefit; rather, it is sold and injected into depleted oil fields for Enhanced Oil Recovery (EOR)35. In this tertiary recovery process, pressurized CO2 mixes with trapped residual crude, reducing its viscosity and forcing it to the surface, extending the lifespan of mature wells42. Currently, the US public subsidizes this process through the Section 45Q tax credit, effectively transferring taxpayer wealth to the oil industry to facilitate increased extraction44.
The industry occasionally suggests that combining EOR with Direct Air Capture (DAC) or point-source capture can yield “carbon-neutral oil.” However, life-cycle mass and volume conservation analyses demonstrate this is a physical impossibility in conventional reservoirs46. A study of 16 EOR projects found that while the process may appear briefly carbon-negative in its initial pressurization phase, it inevitably becomes highly carbon-positive46. The volume of CO2 emitted when the newly recovered oil is eventually burned exceeds the available subterranean pore space freed during extraction by at least a factor of three46. Thus, utilizing CCS for EOR guarantees net atmospheric warming.
Furthermore, outfitting an industrial facility with carbon capture imposes a massive “parasitic” thermodynamic penalty. The energy required to capture, compress, and transport CO2 significantly reduces the net energy output of a power plant, necessitating the combustion of more fossil fuels simply to maintain the baseline power supply40. Additionally, captured CO2 is an extreme asphyxiation hazard; transporting it requires a vast, perilous network of highly pressurized pipelines that pose lethal risks to surrounding communities in the event of a rupture44. Finally, installing CCS at the point of extraction or refining is entirely blind to Scope 3 emissions. Up to 85% to 90% of the greenhouse gases associated with fossil fuels are generated at the point of end-use—when the gas is burned in residential heating systems or automobile engines40. CCS mechanisms are fundamentally incapable of addressing these distributed emissions, rendering the technology an expensive, subsidized greenwashing mechanism designed to lock in fossil fuel infrastructure rather than facilitate a genuine energy transition38.
The Fossil Fuel Industry Replicated the Tobacco Public Relations Playbook to Obscure Early Climate Science and Manufacture the “Clean” Natural Gas Myth
The immense chasm between the fossil fuel industry’s internal understanding of climate physics and its external corporate messaging is not a modern phenomenon; it is the culmination of a sophisticated, multi-decade public relations strategy. Documentary evidence stretching back over 70 years reveals that the oil and gas industry not only understood the catastrophic potential of their products long before the public, but actively coordinated to manufacture scientific doubt and delay regulatory intervention, utilizing the exact methodologies pioneered by the tobacco industry48.
The architecture of fossil fuel disinformation was established in post-war Los Angeles during the 1940s and 1950s. At the time, Southern California was suffering from a devastating smog crisis that choked the city, caused fatal traffic accidents due to poor visibility, and spiked emergency room visits for respiratory distress50. When initial scientific research, notably by Caltech flavor chemist Arie Haagen-Smit, linked the creation of atmospheric ozone to uncombusted hydrocarbons and nitrogen oxides emitting from oil refineries and vehicle exhaust, the industry mounted an aggressive defense50.
In 1947, the Western Oil and Gas Association (WSPA) established the “Smoke and Fumes Committee”51. The committee’s objective was to deflect blame by funding third-party research to cast doubt on established science—a tactic that would become the cornerstone of future climate denial51. The committee funded the Stanford Research Institute (SRI) to challenge Haagen-Smit’s conclusions, publicly dismissing the links between refineries and smog as “unproved speculation”51. To further launder their messaging, the industry secretly established front groups. In 1953, the “Air Pollution Foundation” was launched, ostensibly by concerned “civic leaders,” to conduct unbiased research. However, confidential memos—including one from the Foundation’s president, Lauren B. Hitchcock, following a reprimand by oil executives at the exclusive California Club in 1955—revealed that the group was deeply compromised and directed by the industry to downplay the harms of petroleum pollution51.
By the mid-1950s, this same industry-funded research apparatus inadvertently quantified a far more existential threat. The American Petroleum Institute (API), which had taken over the Smoke and Fumes Committee in 1952, began funding “Project 53” at Caltech, led by geochemists Harrison Brown and Charles David Keeling53. In 1954, Brown and Keeling explicitly reported to the API that the continuous burning of coal and petroleum was causing a marked, steady increase in atmospheric CO2 concentrations54. The following year, the Air Pollution Foundation published research warning that fossil fuel CO2 emissions could have massive long-term consequences for civilization51. An internal 1968 report commissioned by API further warned that atmospheric methane and carbon dioxide from oil fields and distribution leakage could overburden natural environmental sinks49.
Rather than pivoting their business models or warning the public, the industry suppressed these realities and retained public relations firms—notably Hill and Knowlton, the exact firm that orchestrated the tobacco industry’s campaign to deny the link between smoking and lung cancer—to craft a coordinated strategy of deception48. Fearing a loss of market share amid rising environmental consciousness in the 1970s, the natural gas industry pivoted to aggressive rebranding. In 1971, the American Gas Association hired the PR firm J. Walter Thompson to launch a massive advertising campaign labeling gas as “CLEAN ENERGY FOR TODAY AND TOMORROW”49. Internal documents from this campaign explicitly noted that the public falsely perceived electricity as cleaner due to heavy advertising, and that the gas industry needed to heavily promote its “research and development” and “ecology” efforts to maintain its vital residential market49.
The industry systematically downplayed the dangers of methane. A 1990 American Gas Association publication featured headlines like “Studies Suggest Methane Is Not a Major Greenhouse Gas,” selectively quoting scientists to mislead the public49. In 1996, the Gas Research Institute heavily influenced a joint study with the EPA—where EPA officials admitted they lacked the expertise to properly audit the industry’s data—to declare that methane leakage did not offset the benefits of gas, providing false regulatory cover for the massive expansion of natural gas infrastructure49.
Today, this legacy of deception has evolved into sophisticated corporate “greenwashing.” A comprehensive 2022 analysis by the independent think tank InfluenceMap quantified the disparity between the public messaging and actual operations of five oil “supermajors”: BP, Chevron, ExxonMobil, Shell, and TotalEnergies55. Reviewing over 3,400 pieces of public communication, InfluenceMap found that 60% of the companies’ messaging highlighted “green claims”—touting their investments in renewables, emissions reductions, and the transition to a low-carbon economy—while only 23% promoted their core oil and gas products56. The report estimated the supermajors spent roughly $750 million annually on this climate-friendly branding56.
However, a forensic analysis of the companies’ actual capital expenditures (CAPEX) revealed a stark contradiction. Cumulatively, the supermajors dedicated a mere 12% of their 2022 CAPEX to “low-carbon” activities—a category the companies themselves artificially inflated by including natural gas and CCS investments56. Shell presented the most egregious disparity, pushing green claims in 70% of its communications while allocating just 10% of its CAPEX to low-carbon investments56. The remaining 88% of the industry’s vast wealth was aggressively deployed to expand traditional fossil fuel extraction, all while their lobbyists actively pressured policymakers to dilute renewable energy policies and avoid stringent methane regulations56. The fossil fuel industry’s public relations apparatus remains entirely decoupled from its operational reality, designed exclusively to maintain its social license to operate while maximizing hydrocarbon extraction56.
Advances in Extreme Weather Attribution Science Bolster a New Wave of State-Level Consumer Fraud Litigation Against Fossil Fuel Supermajors
The collision between the fossil fuel industry’s documented history of scientific obfuscation, its continuous expansion of hydrocarbon infrastructure, and the rapidly accelerating physical impacts of global warming has birthed a formidable new frontier in climate litigation. Abandoning earlier, largely unsuccessful federal lawsuits based on the broad doctrine of “public nuisance,” a coalition of state Attorneys General and municipal governments are now prosecuting the industry in state courts, utilizing the highly effective legal frameworks of consumer protection, false advertising, and corporate fraud60.
This strategic legal pivot focuses not on the act of extracting oil itself, but on the decades of intentional deception perpetrated against consumers and investors. State Attorneys General from Massachusetts, Minnesota, California, the District of Columbia, and numerous others have filed aggressive lawsuits against entities including ExxonMobil, Chevron, BP, Shell, the American Petroleum Institute, and Koch Industries60.
The legal arguments mirror the successful litigation utilized against the tobacco and opioid industries62. For instance, Massachusetts AG Maura Healey’s lawsuit asserts that ExxonMobil violated the Massachusetts Consumer Protection Act by systematically failing to disclose the catastrophic climate risks of its fossil fuel products to consumers, while simultaneously running deceptive advertising campaigns claiming its products reduced emissions65. Similarly, Minnesota AG Keith Ellison’s lawsuit advances claims of common law fraud, failure to warn, and deceptive trade practices, arguing that the industry fully understood the devastating climatic impacts of its products since the 1970s, yet orchestrated a highly effective public relations campaign to conceal this reality60. By keeping the litigation anchored to specific state consumer protection statutes, plaintiffs have successfully defeated industry motions to elevate the cases to federal courts, ensuring these corporations will face discovery and juries in state venues62.
Crucially, the legal viability of these lawsuits—and the ability to claim specific, quantifiable damages—is being heavily bolstered by rapid advancements in the discipline of “extreme event attribution.” Historically, climate science could only project broad, long-term atmospheric trends; linking a specific local disaster (e.g., a drought or hurricane) directly to global greenhouse gas concentrations was scientifically precarious, complicating legal claims for localized financial restitution.
However, over the past decade, climate modeling has advanced exponentially. As codified in consensus reports by the National Academies of Sciences, Engineering, and Medicine (NASEM) and the Intergovernmental Panel on Climate Change (IPCC), scientists can now formally calculate the exact probabilistic degree to which human-induced warming altered the likelihood and intensity of a specific weather event67.
| Extreme Weather Event Type | Scientific Confidence in Climate Attribution |
|---|---|
| Extreme Heat / Cold Events | High Confidence |
| Droughts (Hydrological / Agricultural) | Medium Confidence |
| Extreme Rainfall / Flooding | Medium Confidence |
| Wildfires / Hurricanes | Lower Confidence (Improving) |
| Severe Convective Storms (Tornadoes) | Little to No Confidence |
Attribution confidence levels based on NASEM assessments. Sources: 69, 70
By combining convection-permitting climate models with massive historical datasets, researchers can isolate the anthropogenic signal from natural variability like El Niño67. For example, attribution studies demonstrated that climate change increased the urban flooding extent in Leeds during a 2014 storm by 16%, and that anthropogenic warming contributed over 42% of the intensity of a devastating compound heatwave-flooding event in the Yangtze River Basin in 202267.
Despite cognitive biases in public perception—where laypeople often struggle with probabilistic math and prefer single-cause explanations for extreme weather—the hard mathematics of event attribution provide state governments with the causal evidence required in tort law69. States can now point to the billions of dollars in infrastructural damage incurred from specific, attribution-verified climate events (such as intense flooding in Minnesota or extreme heat in D.C.) and demand that the corporations who actively delayed climate mitigation bear the financial burden of resilience and adaptation61. As attribution science continues to mature, and as the trove of internal industry documents exposes the depth of historical deception, fossil fuel supermajors face an unprecedented, multi-front legal threat that challenges the financial and reputational foundation of their business models61.
Works cited
- MRP 188: Why Does the U.S. Import Heavy Oil? — The Mineral Rights Podcast. mineralrightspodcast.com
- The United States produces lighter crude oil, imports heavier crude oil — U.S. Energy Information Administration (EIA). eia.gov
- Petroleum Watch — California Energy Commission. energy.ca.gov
- The United States tends to produce lighter crude oil and import heavier crude oil — U.S. Energy Information Administration (EIA). eia.gov
- U.S. crude oil production increases; imports remain strong to support refinery operations — U.S. Energy Information Administration (EIA). eia.gov
- Explain why the US doesn’t refine its own light sweet crude? — r/oil, Reddit. reddit.com
- Gulf Coast (PADD 3) Refinery Thermal Cracking, Coking Downstream Charge Capacity as of January 1 (Barrels per Stream Day) — EIA. eia.gov
- Implications of Light Tight Oil Growth for Refiners in North America and Worldwide — McKinsey. mckinsey.com
- Do all wastewater disposal wells induce earthquakes? — U.S. Geological Survey. usgs.gov
- Railroad Commission’s Seismicity Response List — Permian Basin Oil and Gas Magazine. pboilandgasmagazine.com
- RRC Mitigates Texas Earthquakes. rrc.texas.gov
- Texas RRC Aiming to Curb Permian Quakes with Produced Water Plan. naturalgasintel.com
- Northern Culberson-Reeves Seismic Response Plan — The Railroad Commission of Texas. rrc.texas.gov
- Seismicity Review — The Railroad Commission of Texas. rrc.texas.gov
- New RRC Guidelines Reshape SWD Permitting in the Permian — B3 Insight. b3insight.com
- Life-Cycle Emissions of Natural Gas and Coal in the Power Sector — National Petroleum Council. npc.org
- On the climate benefit of a coal-to-gas shift in Germany’s electric power sector. researchgate.net
- Senator Launches Investigation Into Methane Pollution in the Permian Basin — Inside Climate News. insideclimatenews.org
- Plugging the Leaks: Why Existing Financial Incentives Aren’t Enough to Reduce Methane — Kleinman Center for Energy Policy. kleinmanenergy.upenn.edu
- Reduction of Scope 3 Emissions in Ammonia Production Through Procurement of Certified Natural Gas — MiQ. miq.org
- Implications of Shale Gas Development for Climate Change. researchgate.net
- Methane Emissions from United States Natural Gas Gathering and Processing — Environmental Science & Technology. pubs.acs.org
- Methane Fees’ Effects on Natural Gas Prices and Methane Leakage — Resources for the Future. rff.org
- A Fair Share: Doing the Math on Individual Consumption and Global Warming. researchgate.net
- New Mexico Permian Basin Measured Well Pad Methane Emissions Are a Factor of 5–9 Times Higher Than U.S. EPA Estimates — Environmental Science & Technology. pubs.acs.org
- Reducing Oilfield Methane Emissions — TRP Energy. trpenergy.com
- Assessment of methane emissions from the U.S. oil and gas supply chain. researchgate.net
- Methane emissions from oil and gas production sites and their storage tanks in West Virginia. pmc.ncbi.nlm.nih.gov
- MethaneSAT observations reveal lower methane intensity in New Mexico’s Permian Basin associated with emissions control — Environmental Defense Fund. edf.org
- Methane intensity and emissions across major oil and gas basins and individual jurisdictions using MethaneSAT observations — Atmospheric Chemistry and Physics. acp.copernicus.org
- Permian Basin Is Leaking Four Times More Methane Than Reported. methane-mitigation-show.com
- MethaneSAT data enables novel comparison of methane mitigation efforts in Permian Basin. methanesat.org
- 2025 was a year of highs, lows, and hope for MethaneSAT. methanesat.org
- First look at a system wide view — MethaneSAT. methanesat.org
- Carbon capture: a decarbonisation pipe dream — IEEFA. ieefa.org
- The Carbon Capture Crux — IEEFA. ieefa.org
- IEEFA: Relying on carbon capture in fossil fuel sector will not work. balkangreenenergynews.com
- Carbon capture remains a risky investment for achieving decarbonisation — IEEFA. ieefa.org
- Carbon Capture: CCS | CCUS | CCU — IEEFA. ieefa.org
- Most CCS will not contribute to net zero targets: report — Gas Outlook. gasoutlook.com
- Road to Nowhere — Real Zero Europe. realzeroeurope.org
- Techno-Economic Assessment and Life Cycle Assessment of CO2-EOR — ACS Publications. pubs.acs.org
- A closer look at CCS: Problems and potential — Zero Carbon Analytics. zerocarbon-analytics.org
- Carbon Capture and Storage — Center for International Environmental Law. ciel.org
- Enhanced Oil Recovery in the Energy Transition — Hunton Andrews Kurth LLP. hunton.com
- Carbon footprint of oil produced through enhanced oil recovery using carbon dioxide directly captured from air — Energy & Environmental Science. pubs.rsc.org
- Carbon capture technologies: Topics by Science.gov. science.gov
- A Case-Control Analysis of Exposure to Traffic and Acute Myocardial Infarction. downloads.regulations.gov
- Gas Deception — Center for Climate Integrity. climateintegrity.org
- 50 Years of Progress — South Coast AQMD. aqmd.gov
- Revealed: Big Oil Told 70 Years Ago That Fossil Fuel Emissions Could Impact ‘Civilization’ — DeSmog. desmog.com
- CO2’s Role in Global Warming Has Been on the Oil Industry’s Radar Since the 1960s — Inside Climate News. insideclimatenews.org
- Oil Industry’s Clean Air Fight Against Smog in Los Angeles: A Dress Rehearsal for Climate Change Denial — Inside Climate News. insideclimatenews.org
- Texts on the Political Economy of Climate Change, 2024 — Paolo Cirio. paolocirio.net
- Are US fossil fuel companies doing all they can to reduce GHG emissions? developmenteducation.ie
- Oil companies say they’re going green, but their investments tell another story — Grist. grist.org
- Public communications of oil and gas supermajors since the invasion of Ukraine in 2022. solid-sustainability.org
- The Greenwashers: Big Oil’s words and actions on climate emergency do not match, says study — Down To Earth. downtoearth.org.in
- Oil & Gas Company Claims Reek of Greenwashing — Moms Clean Air Force. momscleanairforce.org
- Minnesota and the District of Columbia Allege Climate Change Deception by Big Oil — Inside Climate News. insideclimatenews.org
- Minnesota and D.C. Attorneys General Sue Fossil Fuel Companies — Climate XChange. climate-xchange.org
- State Environmental Lawsuits Reveal the Growing Power—and Partisanship—of State Attorneys General — Journal of Legislation and Public Policy. nyujlpp.org
- AG Actions Database — The State Energy & Environmental Impact Center. stateimpactcenter.org
- Attorney General Bonta Supports Minnesota Effort to Hold Big Oil Accountable — California Department of Justice. oag.ca.gov
- State Suits Against Oil Companies — State Impact Center. stateimpactcenter.org
- Massachusetts v. Exxon Mobil Corp. — The Climate Litigation Database. climatecasechart.com
- Attribution of Extreme Events to Climate Change. researchgate.net
- Extreme Weather Events and Climate Change Attribution — National Academies. nationalacademies.org
- Comparing public and scientific extreme event attribution to climate change. climateadvocacylab.org
- Attribution of Extreme Weather Events in the Context of Climate Change. sdr.gov
- Attributions for extreme weather events: science and the people. pmc.ncbi.nlm.nih.gov
For those of you who prefer Google Docs here’s the Public’s sharing link.
https://docs.google.com/document/d/1U0Xuq1ILbBL2p4LxtCgKpJEE_V5tUOdOBRGqbVt0rAk/edit?usp=sharing
