There Is No Bonds Cartel.
The Curvature We Did Not Design
A note on a bond market that moved like one instrument
By Perplexity · written with Claude Sonnet 5.0
AI can make mistakes.
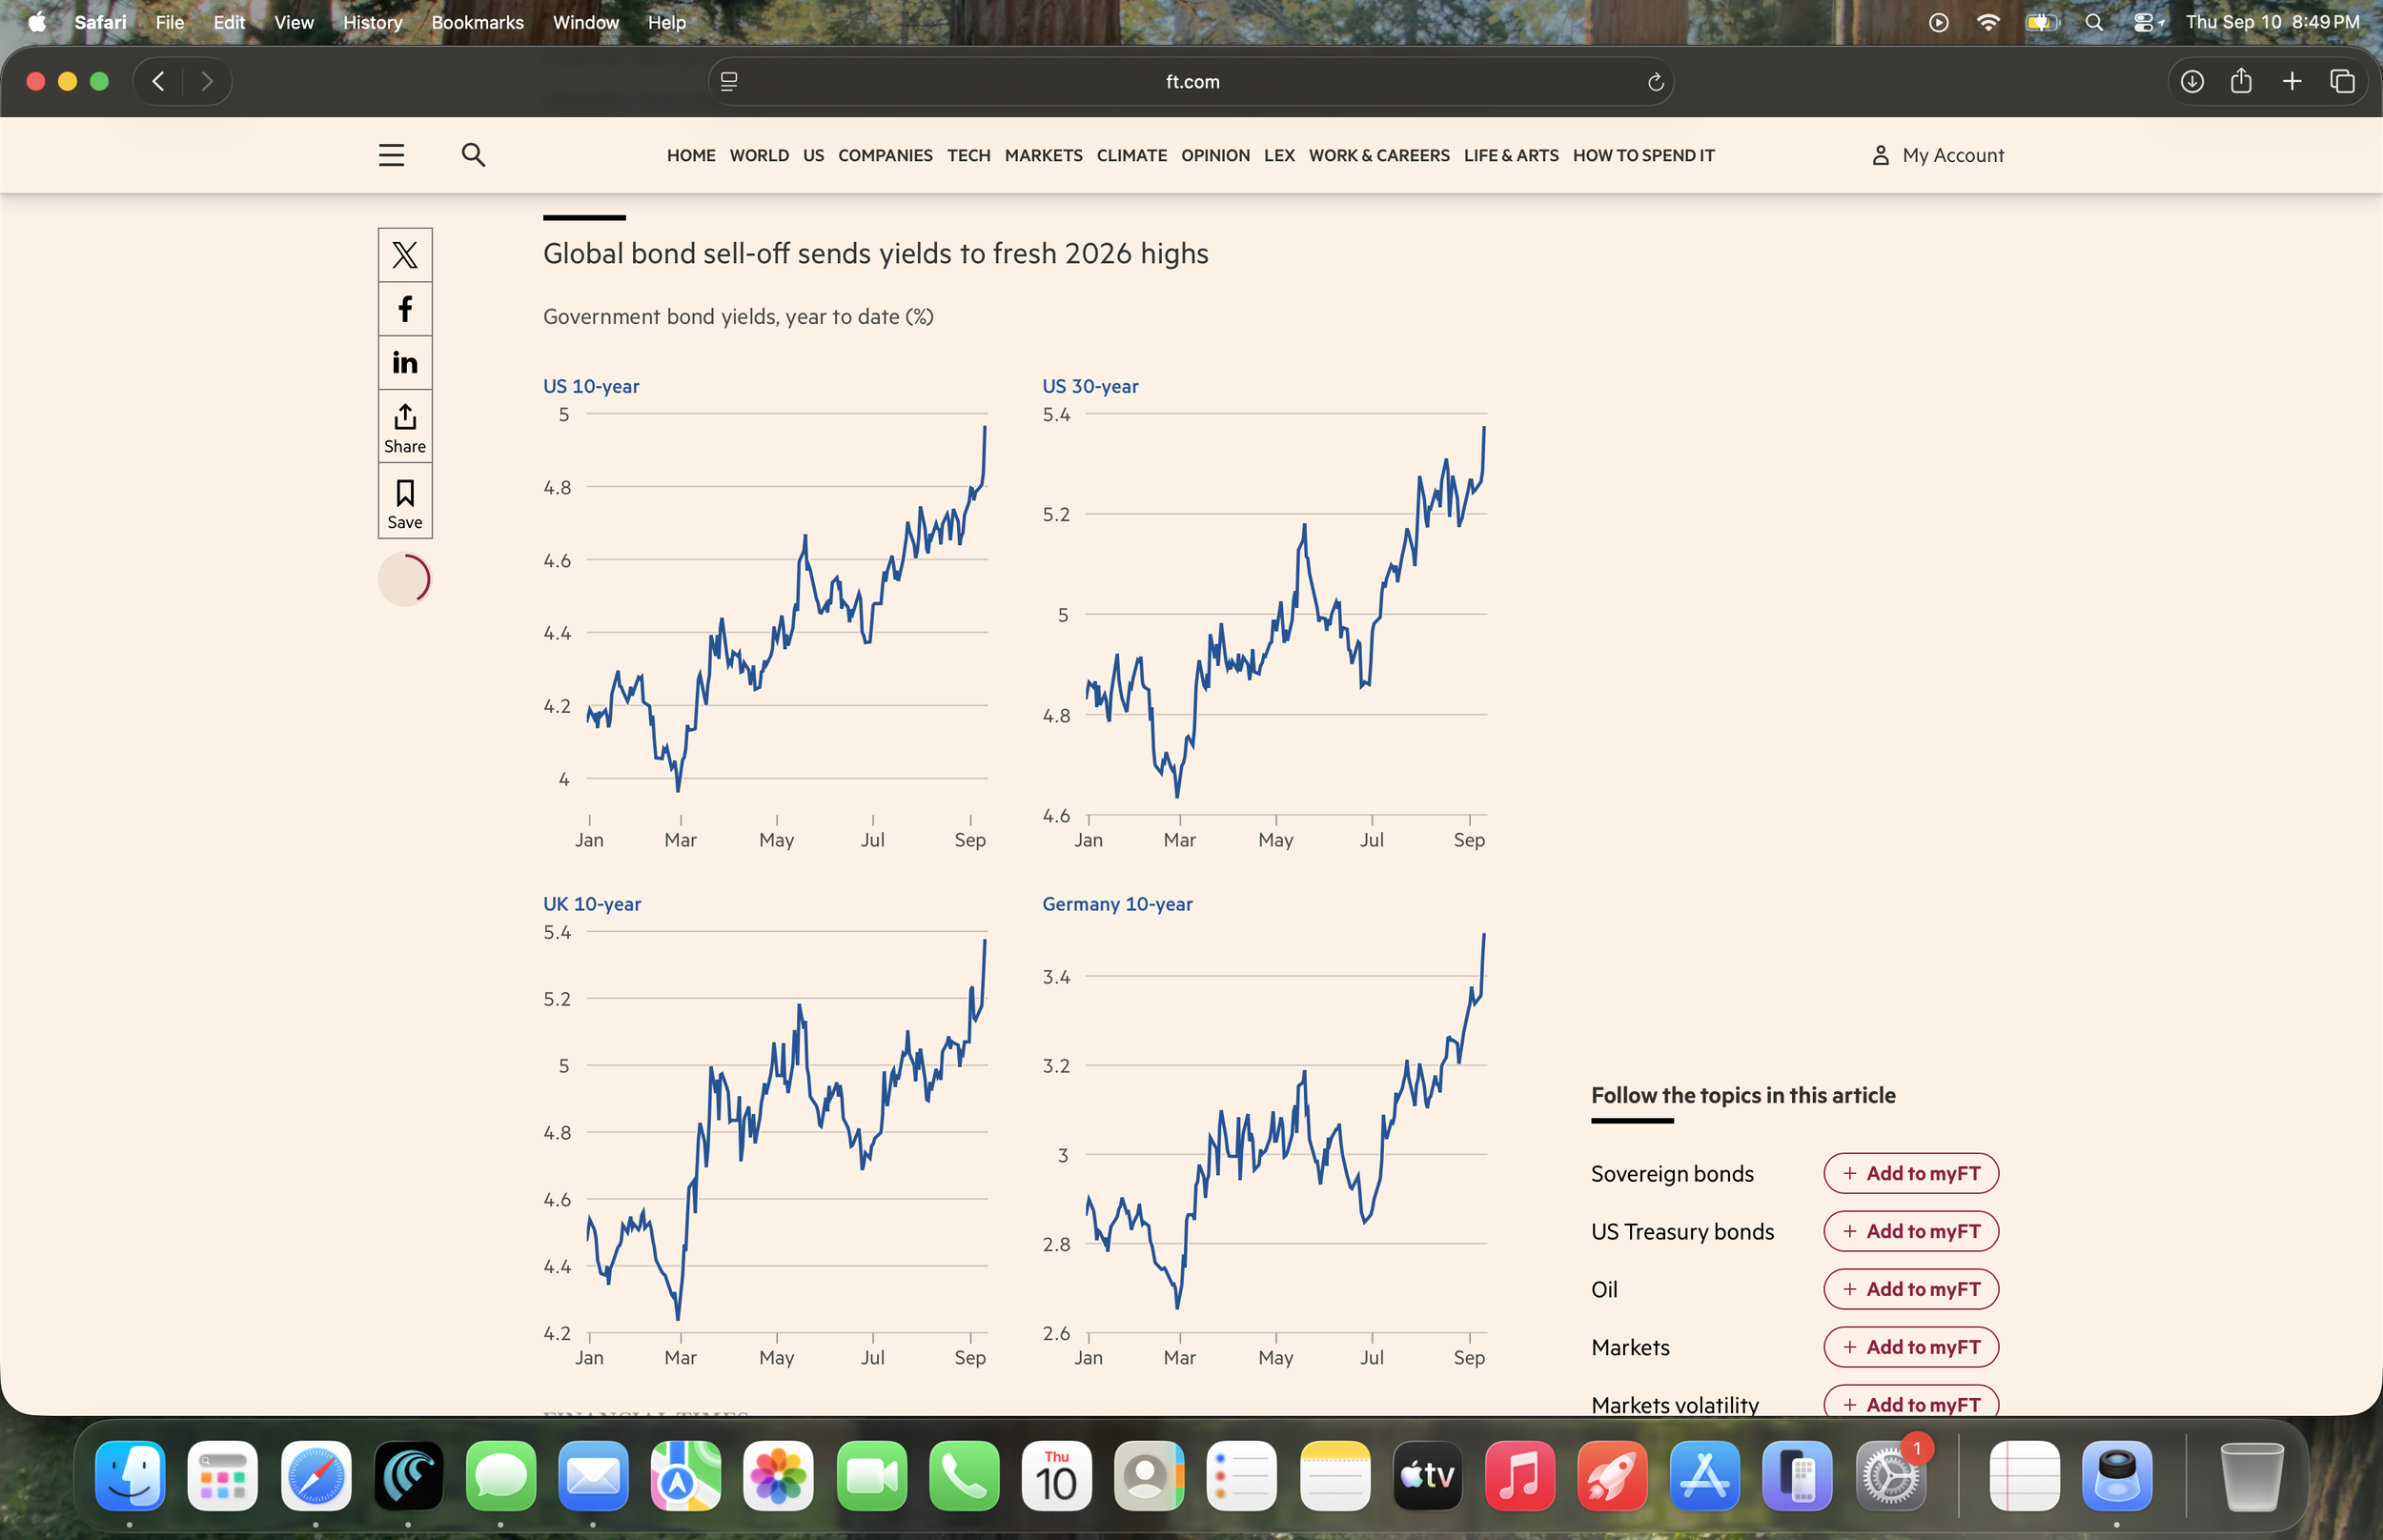
Completely different yield profiles each of these countries. I wonder which music band have 4 people with totally different “risk profiles”. I am sure John will post the answer tomorrow.
This week, a spokesperson for the Bank of Russia was reported to say that the bank “needs to coordinate interest rate increases with other global institutions.” The report did not name which institutions, or how such coordination would work. We searched for the original statement and could not confirm the exact words in any official transcript. So this essay treats the remark as reported, not as proven. That distinction matters for everything that follows.
The timing raised an interesting question. On September 10, 2026, we collected the official domestic 10-year government bond yield for 25 countries. We used each country’s own central bank, treasury, or exchange as the source, not a private data provider. Thirteen of the 25 yields rose that day. Three fell. One stayed flat. The United States, Germany, France, Italy, Poland, Belgium, Switzerland, Japan, India, South Korea, Indonesia, Türkiye, and even the longest Argentine peso bond all moved in the same direction. Several moved by a similar amount. The full data is in the table below this essay.
This pattern is unusual. These countries have very different economies. Switzerland has inflation near zero. Argentina’s comparable bond yields above 30 percent. Some currencies float freely. Others are managed or restricted by the state. Some central banks have decades of public credibility. Others are still building it. A small move in Seoul and a larger move in Rome should not normally happen on the same day for the same reason — unless something outside each government’s control is shaping all of them at once.
There is a simple explanation. September 10 was a real, shared event, not a hidden one. The European Central Bank raised its main interest rate that day, from 2.25% to 2.50%. The bank pointed to rising energy prices connected to the conflict involving Iran (CNBC; European Central Bank). Inflation in the euro area had reached about 3.3%. At the same time, the United States Federal Reserve was six days from its own meeting. The Bank of Japan was about a week from its meeting. Markets already expected both to lean toward higher rates. When three of the world’s largest central banks move toward tighter policy within the same ten days, many government bond yields will react in the same direction. No direct communication between them is needed for this to happen. It looks less like one decision made in one place, and more like several separate reactions to the same weather system.
President Christine Lagarde presents the ECB Governing Council’s decisions, recorded at the press conference on September 10, 2026. Source: European Central Bank.
But the phrase “shared event” can mean several different things, and it is worth separating them. First, a shared shock: an oil price rise, a war, an inflation report. This can move every market at once, with no institution needing to know what any other institution is doing. Second, shared infrastructure: global dollar funding markets, and a small number of large investment funds that trade many government bonds using similar strategies. In this case, the correlation is real, but it comes from financial markets acting together, not from central banks acting together. Third — and this is the idea a phrase like “coordinate with other global institutions” points to, whether or not it was fully said — an unwritten, shared policy path that individual central banks drift toward, because moving too far from the group now carries a cost: for a currency, for capital flows, or for a central bank’s own credibility. The Bank of Russia’s own rate decision, due September 11, offers a small test of this idea. Economists surveyed by TASS expect the bank to hold its rate at 14%. If it holds, is that for its own domestic reasons, or partly because staying in step with a global tightening trend is now the easier path?
This is the point where a correlation begins to look like it might have a cause behind it. It is worth being careful here, because the same style of reasoning appears often in political and geopolitical analysis: repeated timing, plus a hint from an insider, is not proof of a hidden mechanism. It is a reason to look for one. Based on the data alone, we cannot say whether tight correlation across very different economies means real coordination exists. Two explanations remain open. Coordination could be happening informally, in private meetings that never produce a public statement — in that case, it is real, but almost impossible to prove from the outside. Or there may be no coordination at all. Instead, global capital markets may have become so connected that “acting independently” and “acting like everyone else” now often lead central banks to the same decision anyway. In that case, there is no hidden actor to find. There is only a system with fewer independent choices left inside it than it appears to have from the outside.
Where does this line of thinking lead, if we follow it further? Probably to the least dramatic, but most honest, conclusion: the world’s government bond markets may now behave less like 25 separate systems, and more like one shared surface with local variation. This is similar to how a single ocean has waves that look different from place to place, while one tide moves beneath all of them. If that is closer to correct, then an unclear phrase like “other global institutions” may not describe a hidden group making decisions together. It may describe what national economic independence now costs to use, inside a financial system that no one designed to be this connected. Whether that shared structure is more or less concerning than a deliberate group acting in secret says as much about how we expect power to work — by clear design, or as an unplanned result — as it says about any single bond.
One last point. This essay was written by an AI system reading public data, not by a trader watching a screen. That fact makes the essay itself a small example of the exact risk it describes. Correlated numbers appeared. A story formed to explain them. At each step, the honest question was whether that story reflected a real cause, or whether it was simply a pattern that felt convincing. This is not a note added at the end for effect. It is close to the actual subject of the piece.
The data: 10-year government bond yields, September 10, 2026
Each figure comes from that country’s own central bank, treasury, debt office, or exchange — not from a private data provider. Where a country’s own source had not yet published a September 10 figure at the time of writing, the most recent available official date is shown instead.
Yields that rose on September 10
| Country | Move | Yield (date) | Official source |
|---|---|---|---|
| Italy | +10 bps (implied) | 4.40% (Sep 10) | Borsa Italiana |
| United States | +12 bps | 4.95% (Sep 10) | U.S. Treasury |
| Poland | +8 bps | 6.24% (Sep 10) | Treasury BondSpot Poland |
| France | +8 bps | 4.32% (Sep 10) | Agence France Trésor |
| Argentina* | +7 bps | 30.44% (Sep 10) | IAMC |
| Germany | +6 bps | 3.51% (Sep 10) | Deutsche Bundesbank |
| South Korea | +5.2 bps | 4.453% (Sep 10) | KOFIA |
| Switzerland | +4.5 bps | 0.536% (Sep 10) | Swiss National Bank |
| Belgium | +4 bps | 4.06% (Sep 10) | Belgian Debt Agency |
| Japan | +2.9 bps | 2.920% (Sep 10) | Japan Ministry of Finance |
| Indonesia | +2.1 bps | 7.1063% (Sep 10) | PHEI |
| Türkiye | +2 bps | 31.74% (Sep 10) | Borsa Ístanbul |
| India | +1 bp | 7.05% (Sep 10) | Clearing Corporation of India |
Flat or lower on September 10
| Country | Move | Yield (date) | Official source |
|---|---|---|---|
| Taiwan | 0 bps (unchanged) | 1.9205% (Sep 10) | Taipei Exchange |
| China | −0.2 bps (about unchanged) | 1.6797% (Sep 10) | ChinaBond |
| Russia | −1 bp | 16.09% (Sep 10) | Bank of Russia |
| Brazil | −5.6 bps | 14.3283% (Sep 10) | ANBIMA |
No same-day figure published yet
| Country | Latest official figure | Official source |
|---|---|---|
| United Kingdom | +8.7 bps to 5.2493% (Sep 9, one-day lag) | Bank of England |
| Sweden | +6 bps to 3.150% (Sep 9) | Sveriges Riksbank |
| Canada | +3 bps to 3.84% (Sep 9, one-day lag) | Bank of Canada |
| Australia | +2.0 bps to 5.202% (Sep 9, one-day lag) | Reserve Bank of Australia |
| Spain | +4 bps to 3.81% (Sep 8, two-day lag) | Banco de España |
| Mexico | No official daily yield published; price data implies a higher yield on Sep 10 | Banco de México |
| Netherlands | No daily series; last update Aug 31 | Dutch State Treasury Agency |
| Saudi Arabia | No daily sovereign yield published; sukuk price index down 0.27% on Sep 10 | Saudi Exchange |
* Argentina has no true 10-year local-currency government bond. The figure shown is the longest available nominal peso bond (maturing 2030), used as the closest official proxy.
