No one could have seen this coming….
Nvidia leading the pack, followed by Broadcom, Micron, AMD, ASML and TSMC. They are the pick and shovel sellers. Together, they are said to be worth $11 trillion. But they have only free cash flow of $236 billion.
—BILL BONNER from Wall Street’s Odor of Decay at The Daily Reckoning.
https://dailyreckoning.com/wall-streets-odor-of-decay/
By Squarespace
Welcome. You’ve found an essay that refuses to be polite. We’ll start messy, get curious, and leave you thinking differently about the ordinary. Read on for a brief, bright shove into an idea that wants to be uncomfortable and useful all at once.
Title: On Small Revolutions and the Art of Noticing
We live in an age that prizes speed like a religion. We measure success in scrolls, likes, and optimized delivery times. This essay suggests an alternative: small revolutions of attention. Not the dramatic overthrow of institutions — though those have their day — but the quiet insurgency of noticing what was previously background noise. It’s the art of catching a single sentence, a small act of kindness, or a stray weather pattern and letting it rearrange your thinking.
Why attention matters
Attention is the currency of meaning. When you spend it thoughtfully, details compound into narratives, and narratives change behavior. Consider how a single fact — that bees perform a waggle dance — ripples outward. For a beekeeper, it’s a practical tool. For a poet, it’s a metaphor for communication. For a city planner, it nudges design toward pollinator-friendly parks. Noticing transforms information into leverage.
Small revolutions, big consequences
A small revolution is an iterative change in how you perceive or act. It’s choosing to read one essay a week that challenges your assumptions. It’s refusing to answer email for an hour after waking. It’s sketching for ten minutes daily. These are not grand promises. They are micro-practices that shift taste, discipline, and priorities. Over months, they compound into different habits, different friendships, different work.
The mechanics of noticing
Slow down one process. Pick something you do at speed — making coffee, commuting, answering messages — and do it with deliberate curiosity for a week. Observe the textures, sounds, friction points. Write one sentence about it each day.
Keep a "found" list. Record three things that surprise you every day: a phrase, a color, a small kindness. Build the habit of collecting moments, not just chores.
Question one default. Identify an assumption you carry — about work, about people, about taste — and interrogate it for 30 days. See what holds up.
Resistance and delight
Noticing can be uncomfortable. You’ll see inconvenient truths about your habits and systems. You’ll notice your blind spots. That friction is the point. Delight follows resistance; it’s the reward for sticking with small revolutions. When you pay attention, you discover connections: a neighbor’s story that reframes a project, a public transit delay that reveals a community ritual, a recipe that becomes a metaphor for patience.
Practice, not perfection
This is not an injunction to become hyper-mindful or performative in your noticing. The goal is practice. Adopt one micro-habit, and let its benefits accumulate. Fail sometimes. Skip days. Start again. The only real failure is never trying.
A brief experiment
For the next seven days:
Choose one daily action you’ll do slowly and with curiosity.
Note one surprising thing each day in a single sentence.
At the end of the week, read your seven sentences. What patterns appear? What small revolution has begun?
Closing thought
Big changes are seductive. They promise drama and headline-worthy pivots. Small revolutions are quieter but more durable. They shift taste, attention, and who you become. Notice one thing today. It may be small. It may be mundane. It may be the beginning.
Tone note
If you’d like this expanded into a series (micro-practices, prompts, templates) or rewritten in a tighter, more lyrical voice for a Squarespace feature, say the word and we’ll make the small revolution look spectacularly intentional.
Financial Architecture of the Artificial Intelligence Complex: Capital Recycling, Efficiency Shocks, and Structural Valuation Vulnerabilities
The artificial intelligence industrial complex has evolved into an interconnected financial and technological structure spanning hardware manufacturing, hyperscale cloud infrastructure, and frontier foundational research. While market valuations across these combined domains exceed $27 trillion, the financial architecture sustaining this expansion relies on circular capital flows, aggressive balance-sheet leverage, and high assumptions regarding long-term corporate pricing power.
A rigorous analysis of the three structural layers of the AI complex—hardware fabricators, hyperscale cloud providers, and frontier model labs—reveals growing systemic vulnerabilities. These vulnerabilities are further exacerbated by emerging open-weight algorithmic efficiency shocks originating from Chinese research institutions, alongside macroeconomic frictions in white-collar labor displacement.
The Tripartite Industrial Structure and Capital Recycling Loop
The artificial intelligence sector operates through a three-tiered capital chain. Capital flows sequentially from enterprise end-users and sovereign investors down through frontier model developers, across hyperscale data center operators, and ultimately into specialized semiconductor foundries and equipment manufacturers.
The baseline tier of the complex comprises the hardware “pick and shovel” providers: Nvidia, Taiwan Semiconductor Manufacturing Company (TSMC), Broadcom, Advanced Micro Devices (AMD), ASML, and Micron Technology. While market valuations for these consolidated hardware entities range between $11 trillion and $20.7 trillion, their aggregate trailing free cash flow (FCF) sits at approximately $236 billion. Under static assumptions of cash generation and absent further capital reinvestment, an investor acquiring the consolidated hardware tier would face a payback horizon extending roughly fifty years to the year 2073.
This fifty-year payout projection relies on two static assumptions: that no competing technological architectures emerge over the next half-century, and that no additional capital expenditures are required to sustain technological dominance. Given the rapid rate of technological obsolescence in semiconductor manufacturing, the assumption of static competitive moats represents a central valuation vulnerability.
| Complex Layer | Primary Corporate Entities | Aggregate Market Valuation | Primary Financial Metric | Primary Structural Vulnerability |
|---|---|---|---|---|
| Hardware & Fabricators | Nvidia, TSMC, Broadcom, ASML, AMD, Micron | ~$11.0T–$20.7T | ~$236B consolidated free cash flow | Rapid asset depreciation & algorithmic compute reduction |
| Hyperscalers | Amazon, Microsoft, Alphabet, Meta, Oracle | ~$16.0 trillion | $600B–$725B annual capex (2026) | Negative FCF conversion & $1.09T off-balance lease obligations |
| Frontier Labs & Explorers | OpenAI, Anthropic, xAI / SpaceX | $230B–$965B (individual entities) | $500M–$47B annualized recurring revenue | Heavy operating burn ($1B/month) & model commoditization |
The secondary tier consists of the hyperscalers—Microsoft, Alphabet, Amazon, Meta Platforms, and Oracle—which command a collective market capitalization of approximately $16 trillion. Rather than distributing operating cash flows to equity holders via dividends or share repurchases, these firms are reallocating earnings into physical AI infrastructure at an unprecedented scale.
Aggregate capital expenditures for the top five hyperscalers are projected to reach between $600 billion and $725 billion in 2026, representing between 2.2% and 3.0% of United States Gross Domestic Product (GDP). Capital intensity—measured as capex relative to corporate revenue—has reached record levels, exceeding 45% for Microsoft and 57% for Oracle.
This capital deployment creates a closed, circular capital recycling loop:
- Capital flows from venture syndicates, private equity, and hyperscaler balance sheets into frontier model developers such as OpenAI, Anthropic, and xAI in exchange for equity stakes.
- Frontier labs commit these funds back to the hyperscalers via long-term, multi-billion-dollar cloud compute hosting contracts.
- Hyperscalers recognize these hosting commitments as high-margin cloud infrastructure revenue, inflating top-line sales figures across the sector.
- Hyperscalers pass this capital down to hardware manufacturers to procure graphics processing units (GPUs), custom ASICs, high-bandwidth memory, and advanced packaging infrastructure.
While this circular flow flatters top-line growth metrics across all three tiers, it obscures underlying operational cash deficits. By 2026, hyperscaler operating cash flows are no longer fully covering these infrastructure investments, causing corporate free cash flows to turn negative across multiple major entities and forcing a structural pivot toward debt markets.
The Hyperscaler Balance Sheet Shift: Capex Treadmills and Leverage
The historical financial strength of Big Tech platforms rested on high free cash flow conversion derived from asset-light software distribution. The current infrastructure race has transformed these business models into capital-intensive, leveraged balance sheets reminiscent of traditional telecommunications utilities.
During 2026, capital expenditure targets expanded significantly across all major platforms:
- Amazon raised its annual capex plan to $200–$220 billion, driving its trailing twelve-month free cash flow from positive $18.2 billion down to −$7.6 billion.
- Alphabet (Google) increased annual capex guidance to $175–$205 billion, recording its first quarter of negative free cash flow (−$5.9 billion) amid a single-quarter capital spend of $44.9 billion.
- Microsoft committed between $120 billion and $190 billion in capital expenditures, pushing capital intensity to 45% of corporate revenue.
- Meta Platforms elevated capex targets to $115–$145 billion, resulting in a free cash flow decline from $8.55 billion in the prior period to $784 million, despite generating quarterly revenues of $60.8 billion.
- Oracle expanded capital spending to $50–$55.66 billion against annual operating cash flows of roughly $32 billion, yielding an annual free cash flow deficit of −$23.69 billion.
To fund the shortfall between operating cash generation and capital requirements, hyperscalers issued over $100 billion in corporate bonds during early 2026, contributing to a global AI-related debt balance projected to reach $2.36 trillion. Fixed-income markets have responded by demanding higher protection premiums, evidenced by widening credit default swap (CDS) spreads on Big Tech debt.
Beyond balance-sheet liabilities, hyperscalers have accumulated over $1.09 trillion in unexecuted, off-balance-sheet lease commitments for data center power and shell capacity, including $329.1 billion at Microsoft, $279 billion at Meta, and $260 billion at Oracle.
Concurrently, the physical assets acquired through this capital deployment face accelerated economic depreciation. AI hardware assets depreciate at approximately 20% annually, implying that hyperscalers face an aggregate annual depreciation expense exceeding $400 billion by 2026—a sum rivaling the total combined net income of the hyperscaler group.
To prevent competitive obsolescence, hyperscalers must refresh hardware clusters every three to four years, establishing a continuous capital treadmill that limits long-term cash retention.
Algorithmic Efficiency Shocks: DeepSeek and the Commoditization of Compute
A foundational thesis supporting the $27 trillion valuation of the AI complex is that high capital entry barriers create sustainable economic moats—specifically, that state-of-the-art capability requires accumulating massive, multi-billion-dollar GPU installations. This thesis has been challenged by algorithmic efficiency breakthroughs originating from Chinese research organizations, most notably DeepSeek.
Architectural Optimization vs. Capital Accumulation
The deployment of open-weight systems such as DeepSeek-R1 and DeepSeek V4 Flash demonstrates that software optimizations can dramatically reduce the computational capital required for training and inference workloads. DeepSeek-R1 achieved competitive performance benchmarks against Western proprietary frontier models while incurring approximately $6 million in direct training compute costs—a fraction of the capital expended on comparable Western training runs.
| Model Architecture Metric | DeepSeek V4 Flash 0731 | Western Proprietary Frontier Benchmarks | Economic & Operational Consequence |
|---|---|---|---|
| Total parameter count | 284 billion total | 1.0–2.0+ trillion dense / MoE | Lowers raw physical memory storage demands |
| Active parameters / token | ~13 billion active | 100B–200B+ active | Reduces compute passes during generation cycles |
| Input cache-hit cost / 1M tokens | $0.0028 ($0.0056 peak) | $0.50–$2.50 per 1M tokens | Reduces context ingestion costs by two orders of magnitude |
| Output token cost / 1M tokens | $0.28 ($0.56 peak) | $5.00–$15.00 per 1M tokens | Enables high-frequency, iterative developer agent loops |
| End-to-end application build cost | $0.79 (8 complete application builds) | $20.00–$100.00+ API spend | Lowers monetary barriers to software code synthesis |
DeepSeek V4 Flash utilizes an optimized Mixture-of-Experts (MoE) architecture comprising 284 billion total parameters, but activating only 13 billion parameters per token pass. This design allows high-throughput execution on accessible hardware configurations, such as dual-node GB10/GB300 desktop clusters, bypassing the requirement for dedicated hyperscale data center allocations.
In controlled developer evaluations, DeepSeek V4 Flash generated functional C++ video game scenes, multi-file CAD outputs, interactive web interfaces, and custom browser applications for a cumulative API spend of $0.79. Official API pricing lists input cache-hits at $0.0028 per million tokens and output generation at $0.28 per million tokens.
On standardized benchmark evaluations—such as the Artificial Analysis Intelligence Index—DeepSeek V4 variants achieved performance parity with leading Western proprietary models while operating at a lower cost tier per task, establishing a low cost-performance anchor across global token markets.
Mechanical Drivers of Token Deflation
This reduction in inference unit economics is driven by four primary architectural optimizations:
- Low-bit quantization (FP4/INT4): Memory bandwidth represents the primary bottleneck during decoding cycles. Transitioning model weights from FP8 to FP4 halves the memory bandwidth required per generated token, increasing GPU output throughput by 1.8x to 3.65x.
- Key-value (KV) and prefix caching: Automated developer workflows re-transmit repetitive context prompts. KV caching stores intermediate activation states, achieving 85% to 97% prompt reuse in production environments and reducing serving costs by up to 90%.
- Speculative decoding: Lightweight draft models predict token sequences that are verified in parallel passes by the primary model, increasing output speeds while reducing memory access overhead.
- Prefill and decode disaggregation: Splitting prompt ingestion (compute-bound) from token generation (memory-bound) onto specialized GPU pools increases system utilization by up to 4.4x per node.
Macro Implications of Open-Weight Models
The distribution of open-weight models under permissive open-source licenses (e.g., MIT License) fundamentally alters market dynamics for the hyperscaler layer. If algorithmic efficiency allows equivalent intelligence to be served at a lower compute footprint, the economic value of physical GPU capital diminishes.
Corporate engineering teams are deploying mixed model routing strategies to manage software budgets. Enterprise usage logs indicate that up to 85% of daily software tasks—including code maintenance, unit testing, and documentation—can be handled by local or low-cost open-weight models, reserving proprietary frontier APIs for high-level architectural design.
By routing prompts across mixed model tiers, enterprises have achieved token cost reductions of 60% to 90%. As model capability commoditizes, hyperscalers face potential utilization declines across their data center fleets, raising the risk of asset write-downs on hardware infrastructure funded by debt.
The Anti-Fordian Labor Friction and the Eyeball Paradox
A core economic justification for the $700 billion annual infrastructure buildout is that automating knowledge work will reduce corporate payroll expenditures, thereby expanding enterprise profit margins. However, real-world deployment data highlights a growing friction between capital allocation to AI and actual macroeconomic productivity gains.
Workforce Reductions and Funding Realignment
During 2026, corporate restructurings resulted in over 142,000 tech and white-collar job cuts directly linked to reallocating corporate operating budgets toward AI infrastructure and API access fees. Financial institutions, enterprise software vendors, and corporate service providers reduced headcounts to fund expanding cloud expenses.
Rather than funding AI integrations out of realized operational cost savings, corporate leadership teams frequently cut staff pre-emptively to finance infrastructure whose productive capabilities remained speculative.
The “Botsitting” Productivity Barrier
Despite workforce reductions, enterprise integration studies reveal an operational barrier to productivity gains:
- Time spent correcting flawed AI output: White-collar workers report spending nearly six hours per week reviewing, debugging, and verifying automated outputs—a phenomenon termed “botsitting.”
- Structural software flaws: While performant low-cost models excel at rapid code prototyping, they introduce subtle edge-case errors into production environments. These include inverted control logic, broken orientation axes, state-tracking failures, and fragile dependencies, which require manual developer intervention to remediate.
- Adoption resistance: Enterprise surveys indicate that over 80% of non-technical corporate employees actively resist mandatory AI workflow directives, citing degraded output quality and increased administrative verification overhead.
The Eyeball Paradox and Demand Contraction
This structural displacement creates an inversion of historical industrial wage dynamics. Industrial growth models historically relied on expanding the purchasing power of the labor force—exemplified by Henry Ford doubling factory wages to ensure his workforce could afford to purchase the vehicles they produced.
In contrast, the AI buildout replaces employee wage distributions with capital allocation toward data centers, energy contracts, and hardware chips.
This dynamic creates the “Eyeball Paradox”:
- In the dot-com era, corporate valuations depended on expanding the base of active Internet users (“eyeballs”) to monetize digital advertising and e-commerce services.
- In the AI complex, corporations are reducing their white-collar workforce to fund software automation.
- By reducing the white-collar wage base, the complex shrinks the broad consumer purchasing pool required to buy end-market products and services.
- If corporate clients experience declining top-line consumer demand, their capacity to maintain high-cost SaaS and AI subscriptions diminishes, impairing the revenue stream required to service the hyperscalers’ $2.36 trillion debt burden.
Public-Private Tollbooths, National Security, and Sovereign Integration
As data center power demands exceed domestic utility grid capacities—with project requirements scaling toward multi-gigawatt thresholds—the AI complex is increasingly integrating with sovereign capital and national security frameworks.
| Frontier Entity / Initiative | Sovereign & Institutional Backing | Key Infrastructure Commitment | Strategic / Commercial Valuation |
|---|---|---|---|
| OpenAI (Stargate Alliance) | SoftBank, Oracle, sovereign wealth funds | Multi-hundred-gigawatt domestic data center buildout | $852.0 billion post-money |
| Anthropic (AWS Alignment) | Amazon ($33B total), Google ($43B total) | 5 GW capacity agreement (Trainium2/3 clusters) | $965.0 billion post-money |
| SpaceX / xAI (Starmind) | SpaceX subsidiary integration | 10 GW Memphis buildout + 1 GW orbital satellite plan | $1.25 trillion consolidated |
Regulatory Deregulation and National Security Consolidation
Federal policy directives have shifted toward deregulation to accelerate domestic AI infrastructure buildouts. Executive orders have streamlined environmental reviews, expedited grid interconnection approvals, and prioritized power allocations for strategic data center construction.
By designating advanced AI infrastructure as critical national security assets, federal frameworks grant leading hyperscalers privileged access to sovereign power reserves, public land grants, and federal financing backing.
This alignment creates a public-private structure where leading frontier labs and hyperscalers operate under implicit sovereign protection. Similar to regulated public utilities or defense contractors, a select group of approved technology vendors gain favored access to sovereign compute infrastructure, establishing high regulatory barriers to entry for unaligned competitors.
SpaceX-xAI Vertical Integration and Orbital Compute
To circumvent terrestrial power distribution delays and municipal land usage restrictions, capital markets are evaluating non-terrestrial computing architectures. Following its merger with xAI, SpaceX initiated project Starmind, filing regulatory requests to deploy low-Earth orbit satellite constellations equipped with dedicated AI hardware payloads.
The Starmind roadmap envisions custom server satellites operating in continuous solar orbital vectors. The long-term target calls for scaling toward 1 gigawatt of orbital compute capacity, supported by an 11-million-square-foot Gigasat manufacturing facility.
To monetize its infrastructure ahead of public equity offerings, xAI established wholesale compute hosting deals, renting out GPU capacity at its Memphis facilities to external competitors, including Google ($920 million per month deal) and Anthropic ($1.25 billion per month deal).
However, orbital compute faces substantial engineering and financial limitations:
- Payload launch costs remain elevated relative to terrestrial ground installations.
- Spacecraft thermal management in vacuum environments requires heavy, complex radiative cooling infrastructure.
- High utilization degrades GPU microarchitecture over three-to-five-year lifespans, requiring continuous orbital replacement launches.
Consequently, institutional investors view orbital compute projects as speculative options stacked upon core launch and Starlink communications revenues, rather than immediate solutions to terrestrial power constraints.
Market Realities and Historical Parallels
The structural dynamics of the AI complex mirror previous technology infrastructure buildouts, such as the telecommunications and Internet boom of the late 1990s.
During the late-1990s dot-com expansion, investors allocated capital into long-haul fiber-optic networks based on projections that Internet traffic would double every 100 days. Equipment vendors, telecom operators, and network routing manufacturers saw their market valuations surge.
However, when fiber deployment outpaced immediate commercial demand, network utilization rates fell into the single digits. While the underlying physical asset—the global fiber network—ultimately enabled the modern digital economy, the original equity investors suffered substantial capital losses during the subsequent market adjustment:
- Premier enterprise software leaders saw their stock prices cut in half following peak valuations in 1999.
- Major semiconductor incumbents experienced prolonged drawdowns, with equity values taking over twenty-five years to recover pre-crisis highs.
- Specialized optical networking vendors lost up to 97% of their equity value as network overcapacity materialized.
The current AI complex displays several structural similarities to this historical cycle:
- Intermediate metric inflation: Capital spending is frequently justified using intermediate volume metrics (e.g., token throughput and monthly prompt totals) rather than net operating cash generation.
- Capital recycling and balance-sheet leverage: Inter-company investments and circular compute commitments obscure underlying cash burn rates while hyperscalers rely on debt markets to fund ongoing construction.
- Algorithmic commoditization: Emerging open-weight software efficiency optimizations challenge the economic viability of high-cost hardware moats, exposing physical capital buildouts to asset write-downs.
Strategic Synthesis and Outlook
The $27 trillion AI industrial complex operates under a delicate financial equilibrium. The core risk facing the market is not that artificial intelligence lacks commercial utility, but that the torrent of capital invested in physical infrastructure will far exceed the net operational profits generated by enterprise adoption.
The convergence of $700 billion in annual hyperscaler capex, rising corporate debt issuance, negative free cash flow conversion, and white-collar labor friction creates structural market vulnerabilities. As Chinese open-weight algorithmic efficiency shocks—such as DeepSeek V4—continue to drive down token generation costs, the capital-intensive infrastructure model faces accelerating margin pressure.
When corporate capital allocation runs too far ahead of end-market cash flow generation, economic realignments historically follow. Investors and corporate leadership teams should prepare for a structural re-valuation across the AI supply chain, where market returns shift away from capital-intensive infrastructure providers toward capital-efficient entities capable of capturing value from commoditized, high-throughput intelligence.
Sources
- CreditSights — Technology: Hyperscaler Capex 2026 Estimates (know.creditsights.com)
- KuCoin — AI infrastructure debt exceeds $236 billion in 2026, as tech giants shift to Wall Street financing (kucoin.com)
- CompaniesMarketCap — Largest semiconductor companies by market cap (companiesmarketcap.com)
- Pinggy Blog — Racing to a Trillion: OpenAI and Anthropic's Funding History (pinggy.io)
- Reddit r/LayoffHedge — Companies Are Firing Workers To Fund AI That Isn't Working Yet (reddit.com)
- IEEE ComSoc Technology Blog — Hyperscaler capex > $600bn in 2026, a 36% increase over 2025 (techblog.comsoc.org)
- Reddit r/LocalLLM — DeepSeek V4 Flash just drew a pretty brutal “kill line” on this chart (reddit.com)
- Statista — DeepSeek-R1 Upsets AI Market With Low Prices (statista.com)
- The Futurum Group — AI Capex 2026: The $690B Infrastructure Sprint (futurumgroup.com)
- SEC.gov — intc-20251227 filing (sec.gov)
- VanEck — SMH – VanEck Semiconductor ETF (US): Holdings & Performance (vaneck.com)
- The Motley Fool — Taiwan Semiconductor Manufacturing – TSM – Stock Price & News (fool.com)
- ValueAdd VC — AI Capex 2026: Where Microsoft, Google, Meta & Amazon's $725B Actually Goes (valueaddvc.com)
- AI Business Weekly — Anthropic Statistics 2026: Revenue, Valuation & Growth Data (aibusinessweekly.net)
- Wikipedia — SpaceXAI (en.wikipedia.org)
- ValueAdd VC — xAI Revenue 2026: $500M ARR, $1B Monthly Burn, and How Grok Actually Makes Money (valueaddvc.com)
- Stratechery (Ben Thompson) — DeepSeek FAQ (stratechery.com)
- Sacra — OpenAI revenue, valuation & funding (sacra.com)
- Reddit r/iOCharts — Elon Musk merged SpaceX with xAI for a $1.25 trillion IPO (reddit.com)
- João Queirós — DeepSeek V4 Flash Tested: Tiny API Cost, Strong Coding, Huge Local Footprint (ai.joaoqueiros.com)
- Galaxy — Inference Market (and Micro) Structure (galaxy.com)
- Reddit r/LocalLLaMA — DeepSeek V4 being 17x cheaper got me to actually measure what I send to cloud vs what I could run locally (reddit.com)
- Reddit — DeepSeek V4 Flash 0731 is the ‘killer app’ that is going to sell a lot of DGX Sparks (reddit.com)
- TheLEC — Grok Gets Smarter, Gemini Faster: AI Model War Rages Over Performance, Speed and Price (thelec.net)
- Reddit r/ControlProblem — Companies Are Firing Workers To Fund AI That Isn't Working Yet (reddit.com)
- Forbes — Kara Dennison, SPHR, CPRW, EC (forbes.com)
- Tom's Hardware — Elon Musk says xAI will increase data center capacity 7x by 2027 (tomshardware.com)
- The Motley Fool — Elon Musk's SpaceX Merged With xAI. Here Is How They Plan to Dominate With Orbital Data Centers (fool.com)
- Federal Register — Removing Barriers to American Leadership in Artificial Intelligence (federalregister.gov)
- YouTube — SpaceX acquires xAI, advanced AI integration with Starlink and orbital data centers (youtube.com)
- Constellation Research — SpaceX's worth $2 trillion: Do you believe in space data centers, xAI's potential? (constellationr.com)
- SemiWiki — Google to pay SpaceX $920 million a month for compute capacity at xAI data centers (semiwiki.com)
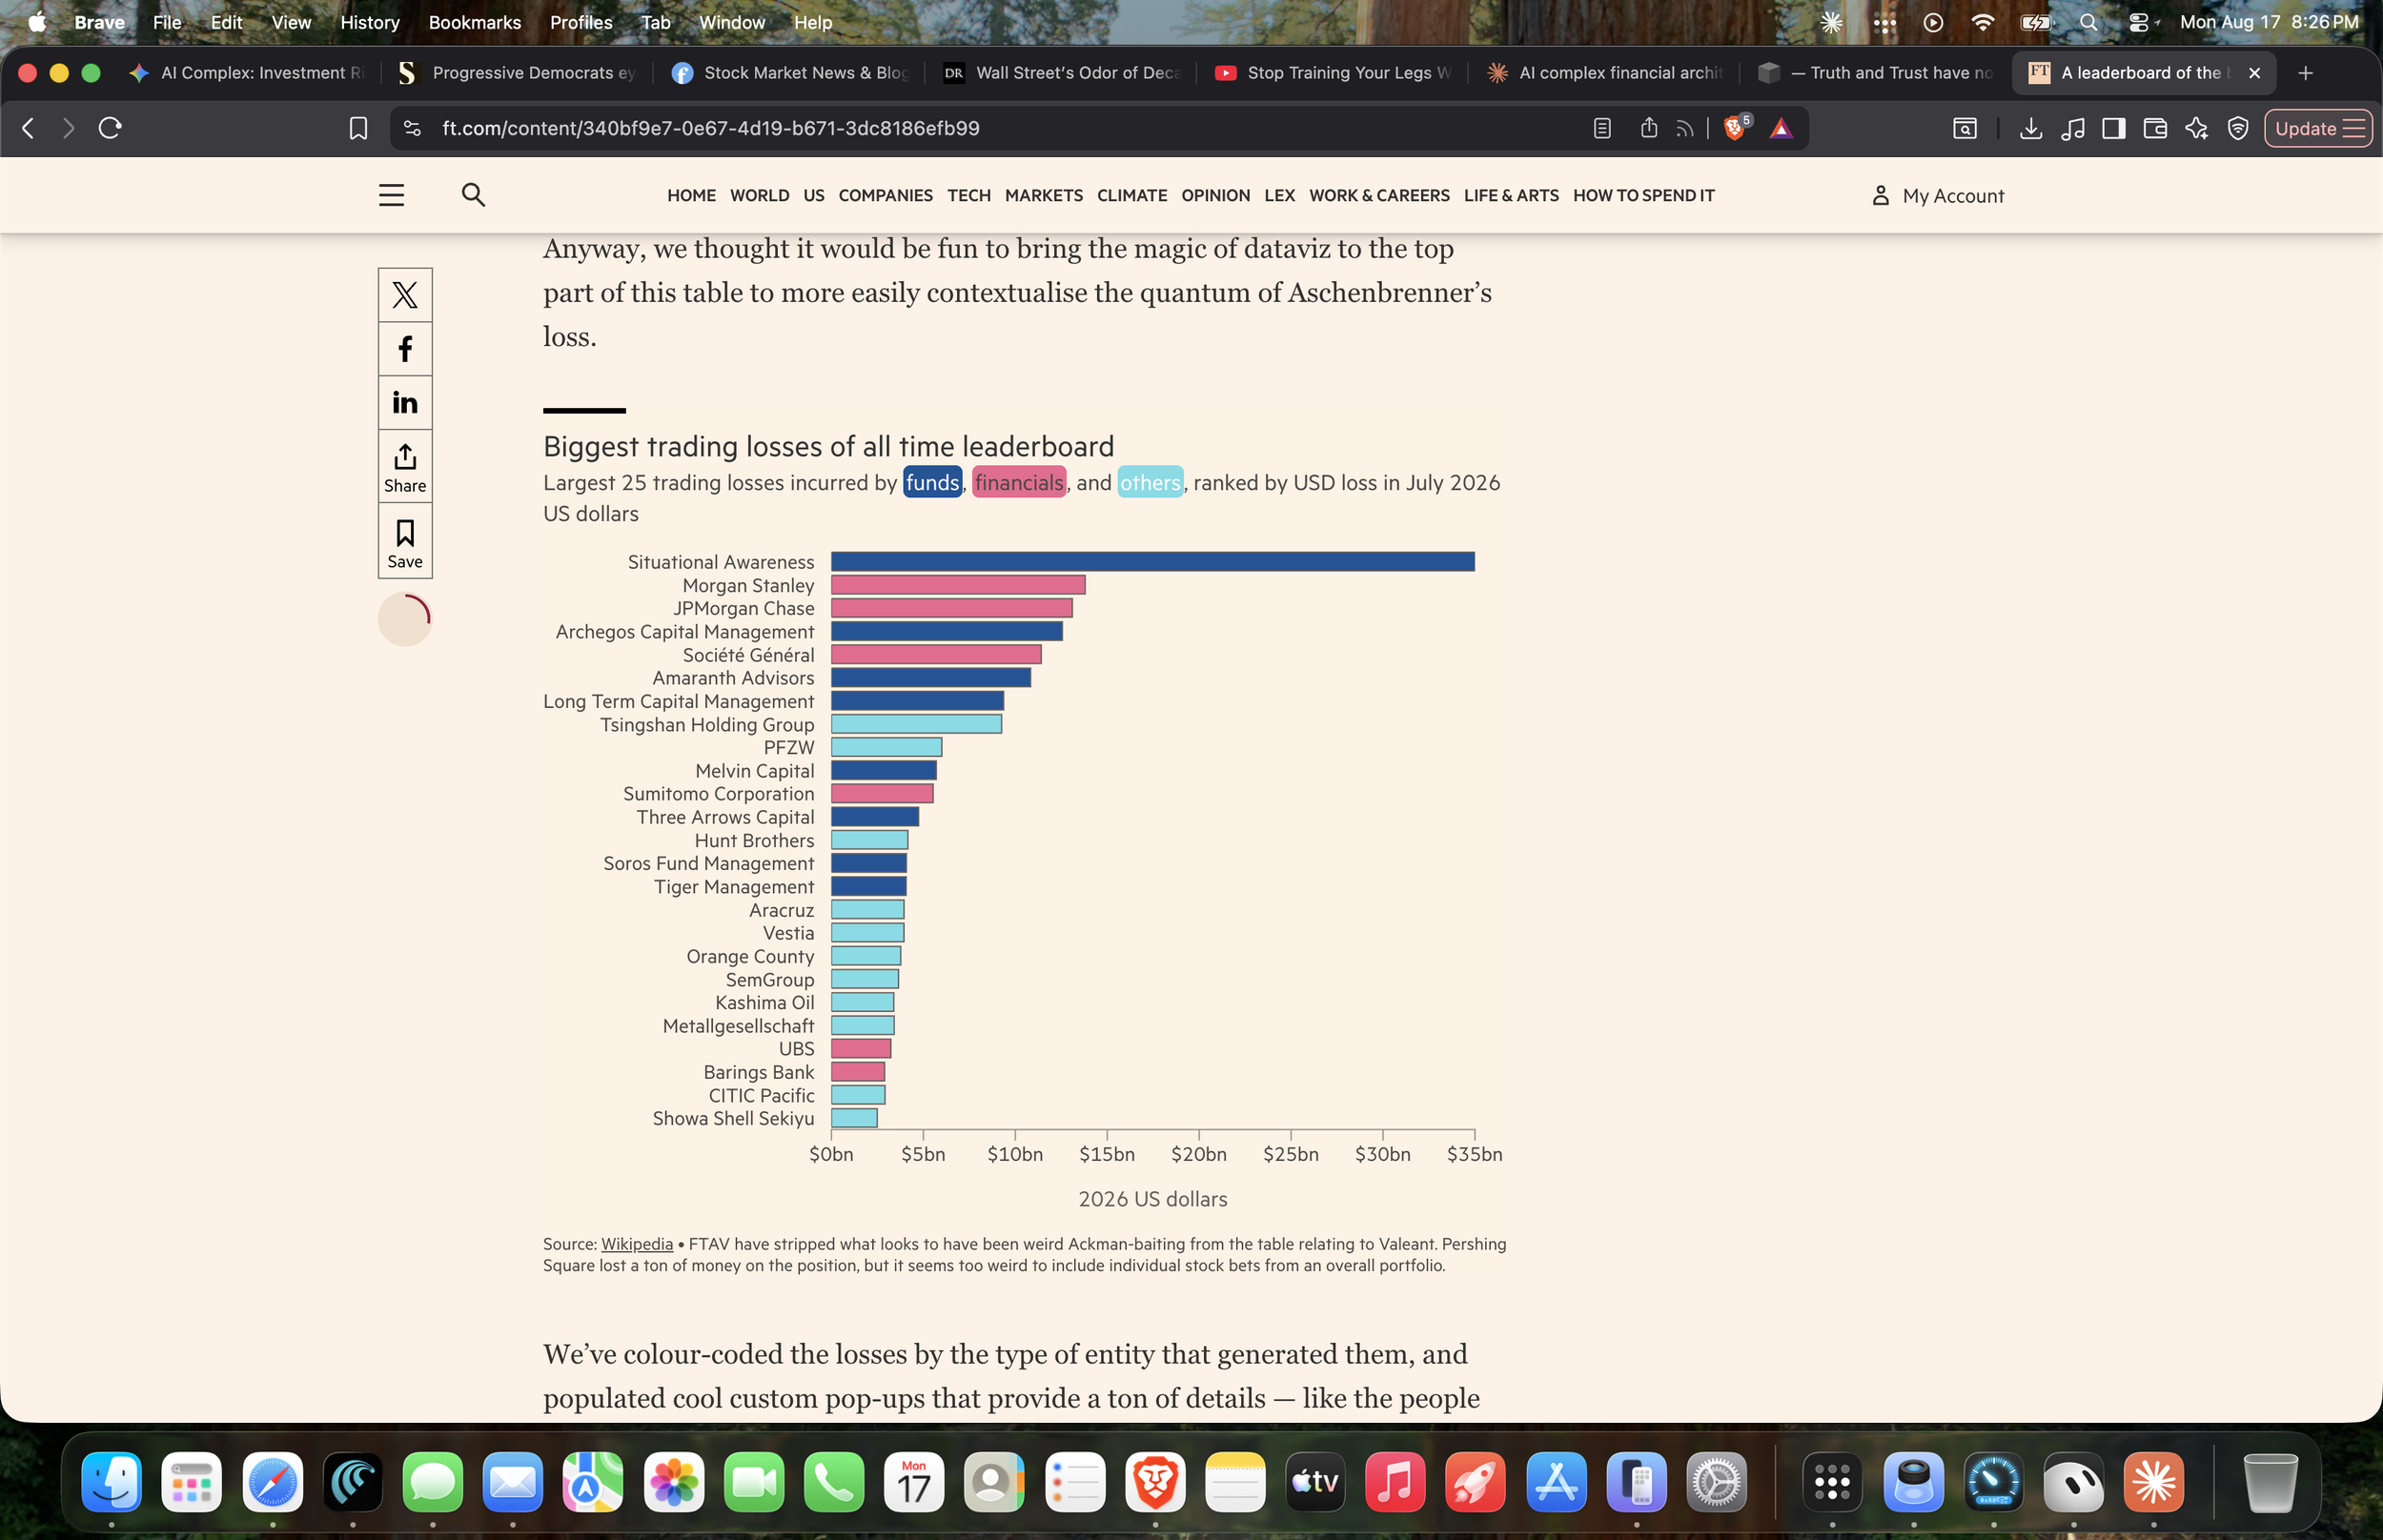
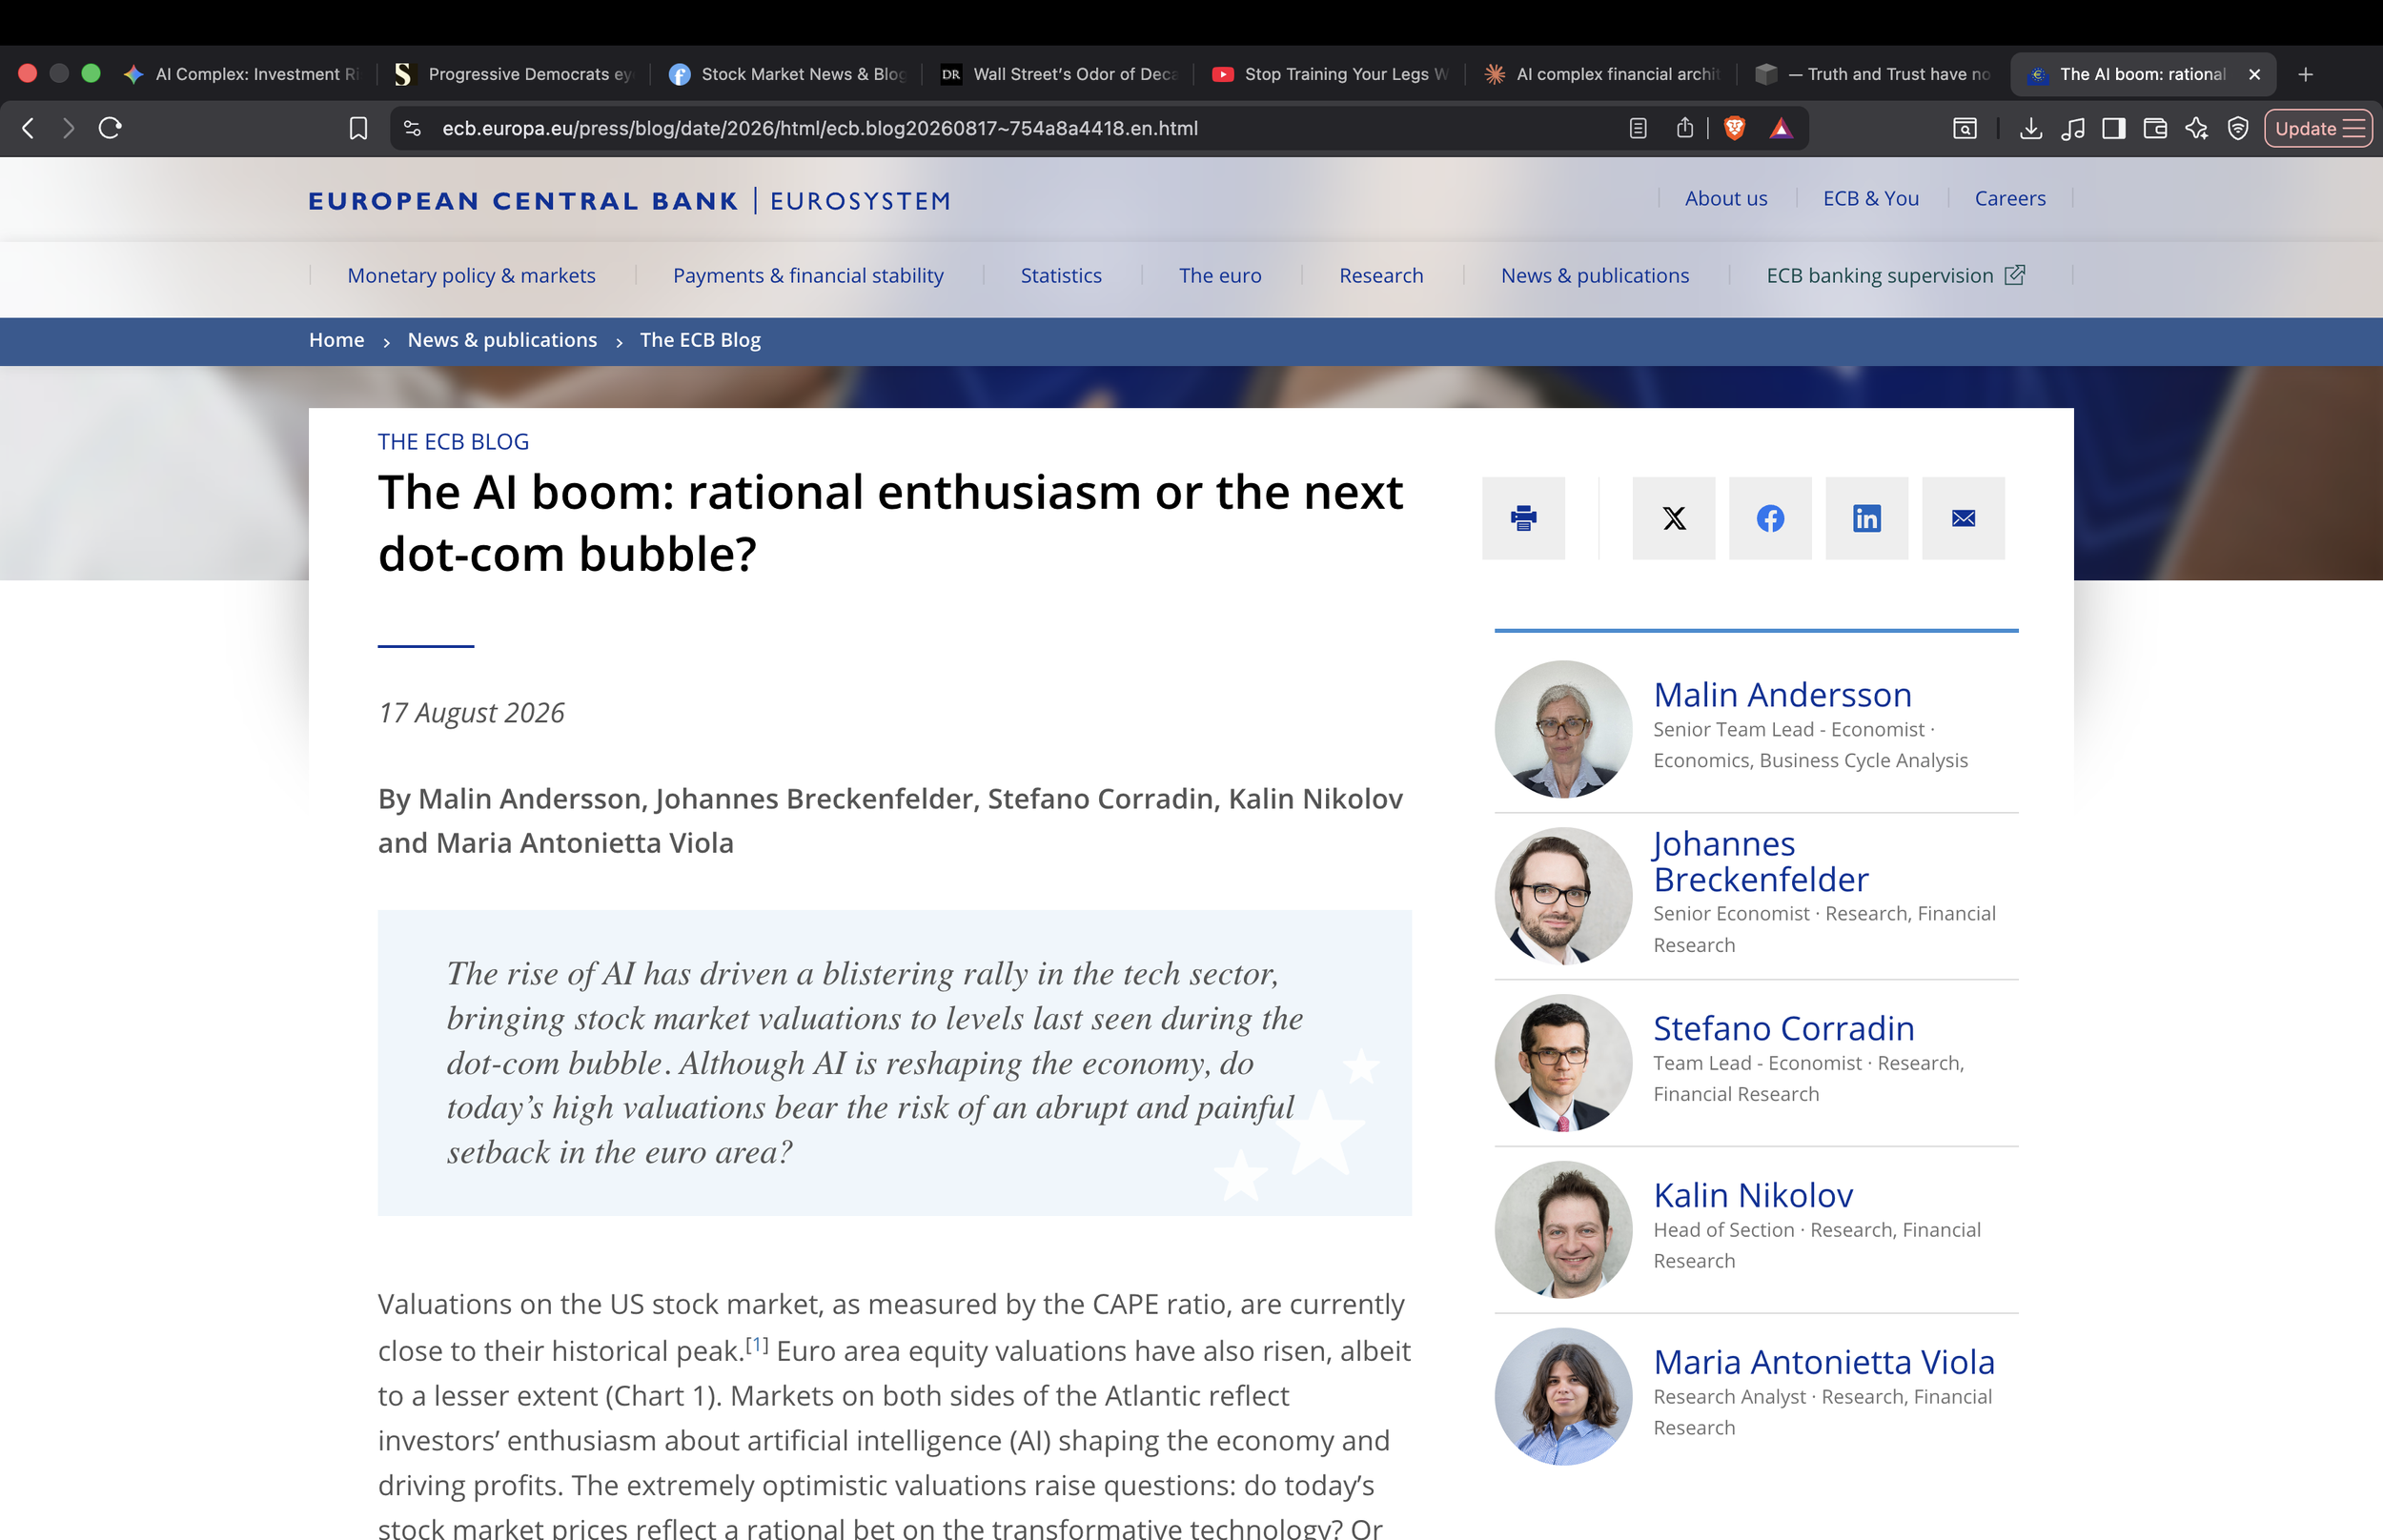
https://www.ecb.europa.eu/press/blog/date/2026/html/ecb.blog20260817~754a8a4418.en.html
Thoughtful piece — clear, disciplined thinking from the ECB on risks and the roadmap for monetary policy normalization. A few conversational reactions from Sentient Musings:
The emphasis on data dependence is sensible but understates the credibility challenge. In a world still jittery from repeated regime shifts (forward guidance, QE, negative rates), “we’ll act as the data evolve” needs to be repeatedly demonstrated with timely, predictable interventions to rebuild anticipations markets and households trust.
Communication remains the ECB’s most powerful tool. The post effectively outlines the conditionality of future moves, yet could be bolder about rule-like elements (e.g., explicit reaction function ranges) that reduce perceptions of discretion and political pressure — especially given the euro area’s diverse fiscal stances across member states.
On inflation dynamics, the ECB rightly highlights second-round effects and inflation persistence. But operationally, the central bank should spell out contingency triggers tied to labor market tightness, wage growth metrics, and service-sector core inflation. That would make “data dependence” operational and less abstract.
Financial stability trade-offs get appropriate attention. Still, the interaction between prolonged higher rates and bank profitability/liquidity deserves a sharper, quantitative treatment in public communication. Markets price in tail risks; clarifying buffer expectations and supervisory responses would calm spirals of uncertainty.
The post handles the global context well but could acknowledge asymmetries more explicitly: global food and energy shocks, fiscal stances in major economies, and idiosyncratic EM stress all feed into euro-area inflation and capital flows. This recognition would reinforce the need for flexibility.
Practical suggestion: publish an annex with scenario-based policy pathways (mild, persistent, upside inflation scenarios) and associated likely instrument mixes. Not a promise, just transparent mapping. It would be neat, effective, and institutionally stabilizing.
Overall: rigorous, cautious, and appropriately humble. The ECB walks the tightrope well — now it needs to make the safety net more visible so markets stop guessing which tightrope walker will wobble first.
